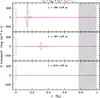
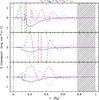
Fig. 9

Upper panels: heat transport for a 1.1
M⊙ star
(Z = Z⊙) at three different epochs
indicated in each panel with the terms non-stationary
( ; magenta solid
line), barotropic (
; magenta solid
line), barotropic ( ; blue dashed
line), baroclinic (
; blue dashed
line), baroclinic ( ; red dotted
line), and advective (
; red dotted
line), and advective ( ; black long
dashed line), and the contribution due to nuclear and gravitational energy
variations (
; black long
dashed line), and the contribution due to nuclear and gravitational energy
variations ( ;
green dashed-dotted line). Lower panels: similar to the upper panel
with a zoom on the small amplitude components. Hatched areas indicate the convective
envelope.
;
green dashed-dotted line). Lower panels: similar to the upper panel
with a zoom on the small amplitude components. Hatched areas indicate the convective
envelope.
Current usage metrics show cumulative count of Article Views (full-text article views including HTML views, PDF and ePub downloads, according to the available data) and Abstracts Views on Vision4Press platform.
Data correspond to usage on the plateform after 2015. The current usage metrics is available 48-96 hours after online publication and is updated daily on week days.
Initial download of the metrics may take a while.