Fig. 9
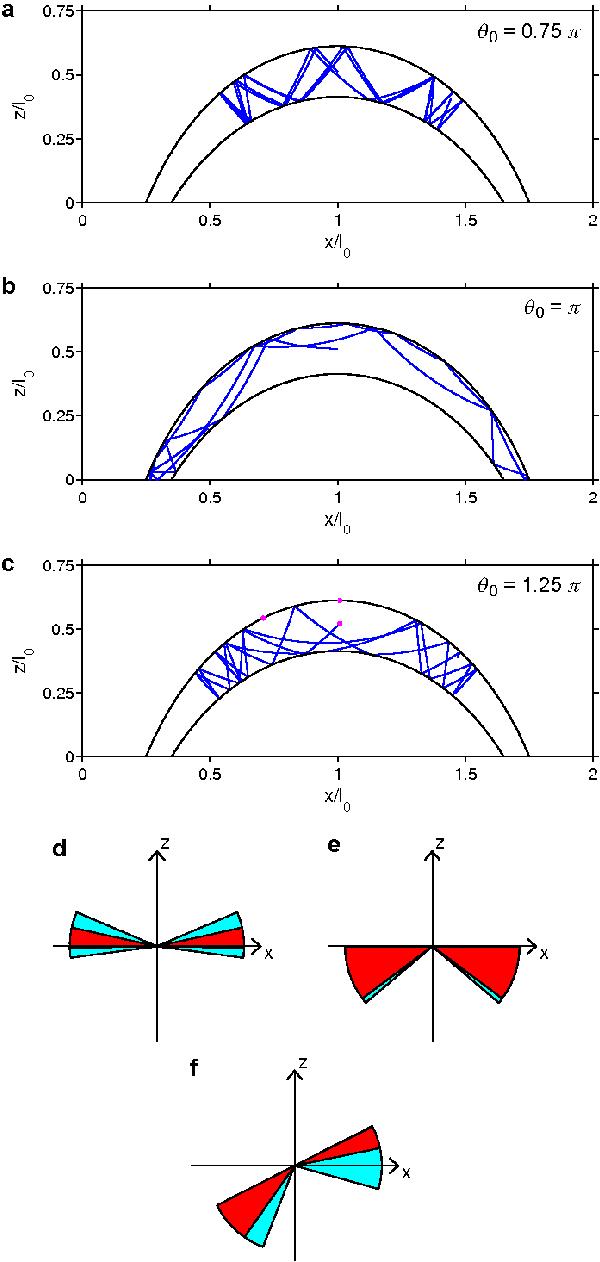
Ray tracing analysis tracking reflections inside an overdense loop. Parts a), b) and c) show trajectories of waves launched from the centre of the loop with initial angles of 0.75π, π and 1.25π (measured anti-clockwise from the x-direction). Parts d), e) and f) show the initial ray angles for which waves emanating from the centre of the loop (x0 = l0, z0 = 0.512l0, panel d)), top of the loop (x0 = l0, z0 = 0.611l0, panel e)), and a point on the upper boundary not on the central axis (x0 = 0.7l0, z0 = 0.537l0, panel f)) reach the chromosphere (cyan and red segments) and the subset of rays perfectly trapped by total internal reflection (red segments only). Source locations used in d) to f) are indicated by the magenta circles in panel c).
Current usage metrics show cumulative count of Article Views (full-text article views including HTML views, PDF and ePub downloads, according to the available data) and Abstracts Views on Vision4Press platform.
Data correspond to usage on the plateform after 2015. The current usage metrics is available 48-96 hours after online publication and is updated daily on week days.
Initial download of the metrics may take a while.