Free Access
Fig. 6
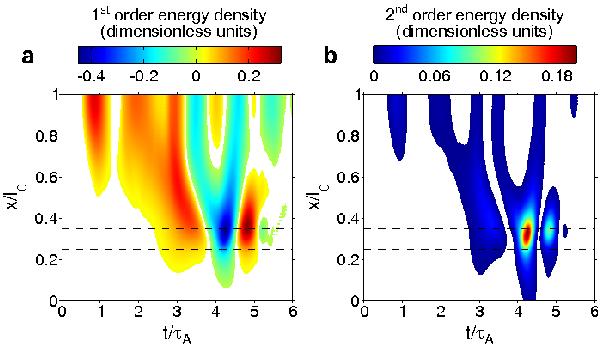
Energy delivered to bottom boundary by fast wave excited inside an overdense loop. Part a) shows first order energy density. Part b) shows second order energy density. Horizontal dashed lines mark the footpoints of the overdense loop.
Current usage metrics show cumulative count of Article Views (full-text article views including HTML views, PDF and ePub downloads, according to the available data) and Abstracts Views on Vision4Press platform.
Data correspond to usage on the plateform after 2015. The current usage metrics is available 48-96 hours after online publication and is updated daily on week days.
Initial download of the metrics may take a while.