Free Access
Fig. 7
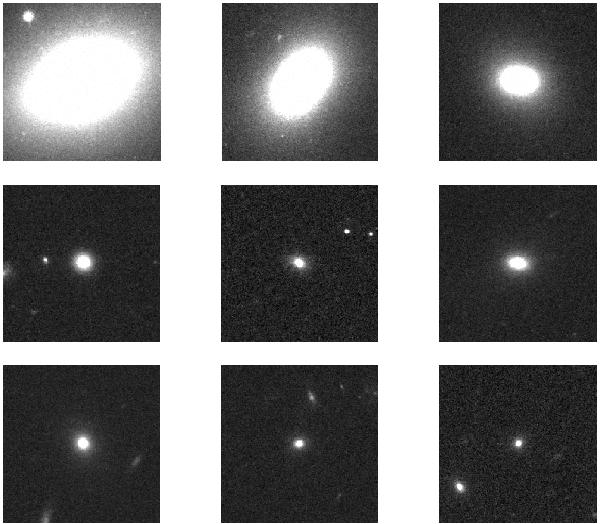
Examples of ACS morphology for a subsample of the red and passive ETGs with elliptical morphologies. The galaxies are shown at increasing redshift from upper left to lower right, from z = 0.0791 to z = 0.9302.
Current usage metrics show cumulative count of Article Views (full-text article views including HTML views, PDF and ePub downloads, according to the available data) and Abstracts Views on Vision4Press platform.
Data correspond to usage on the plateform after 2015. The current usage metrics is available 48-96 hours after online publication and is updated daily on week days.
Initial download of the metrics may take a while.