Fig. 6
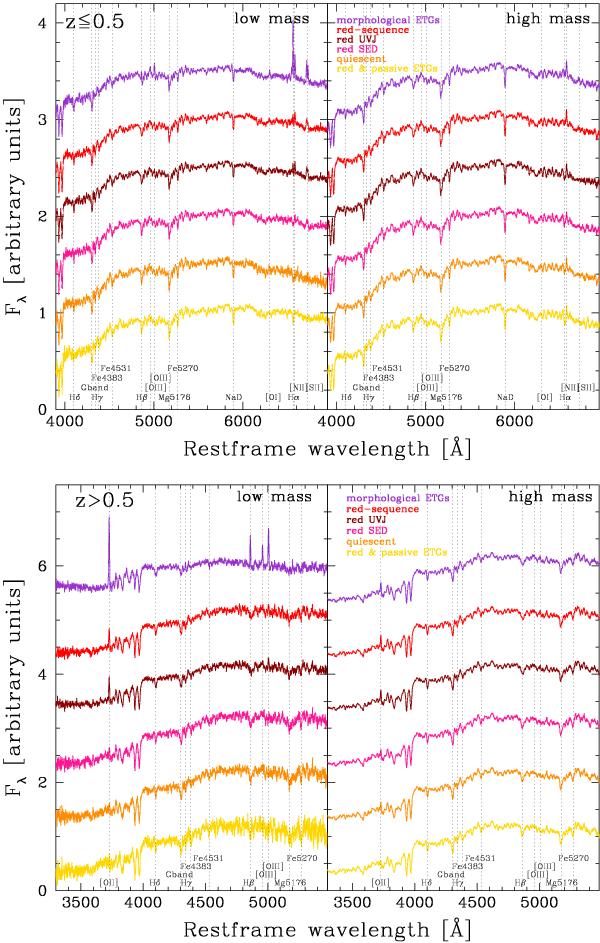
Median stacked spectra obtained for z ≤ 0.5 (upper plot) and z > 0.5 (lower plot); the spectra have been evaluated in the low-mass bin (log (M/M⊙) < 10.25, left panels) and in the high-mass bin (log (M/M⊙) > 10.75, right panels). In violet are shown the morphological ETGs, in light red the red-sequence galaxies, in dark red the red UVJ galaxies, in pink the red SED galaxies, in orange the quiescent galaxies, and in yellow the red and passive ETGs.
Current usage metrics show cumulative count of Article Views (full-text article views including HTML views, PDF and ePub downloads, according to the available data) and Abstracts Views on Vision4Press platform.
Data correspond to usage on the plateform after 2015. The current usage metrics is available 48-96 hours after online publication and is updated daily on week days.
Initial download of the metrics may take a while.