Fig. 4
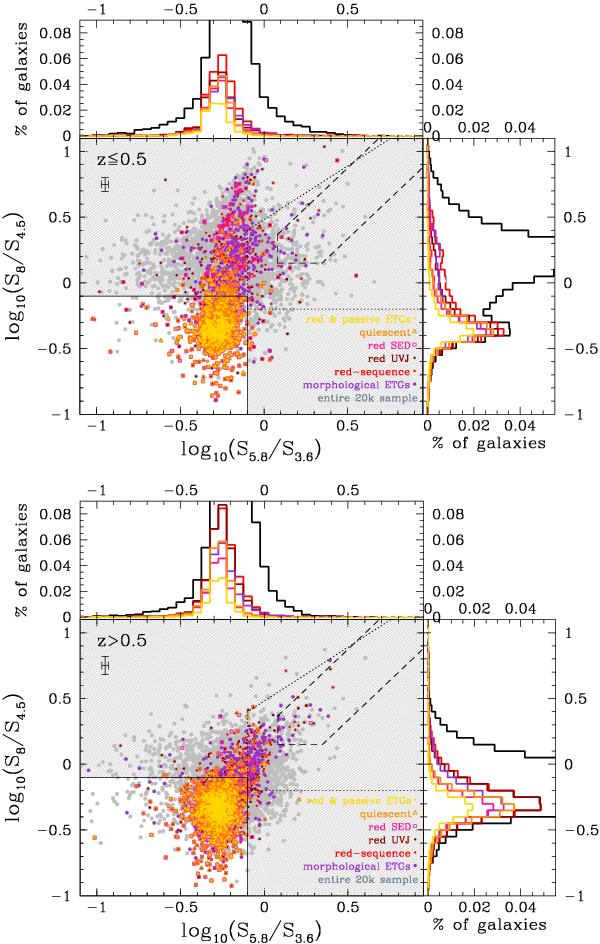
log (S8.0/S4.5) − log (S5.8/S3.6) diagram. In gray is shown the entire zCOSMOS-20k sample, in violet the morphological ETGs, in light red the red-sequence galaxies, in dark red the red UVJ galaxies, in pink the red SED galaxies, in orange the quiescent galaxies, and in yellow the red & passive ETGs. The upper plot shows the log (S8.0/S4.5) − log (S5.8/S3.6) diagram obtained for z ≤ 0.5, and the lower plot shows the diagram obtained for z > 0.5. The gray hatched area represents the region that falls outside the passive region of the IRAC color−color diagram, as defined in Sect. 3.1. The dotted lines represent the region defined by Lacy et al. (2004) to identify AGN candidates, and the dashed lines the revised definition by Donley et al. (2012). The representative errorbar for both quantities is shown in the bottom right corner.
Current usage metrics show cumulative count of Article Views (full-text article views including HTML views, PDF and ePub downloads, according to the available data) and Abstracts Views on Vision4Press platform.
Data correspond to usage on the plateform after 2015. The current usage metrics is available 48-96 hours after online publication and is updated daily on week days.
Initial download of the metrics may take a while.