Fig. 13
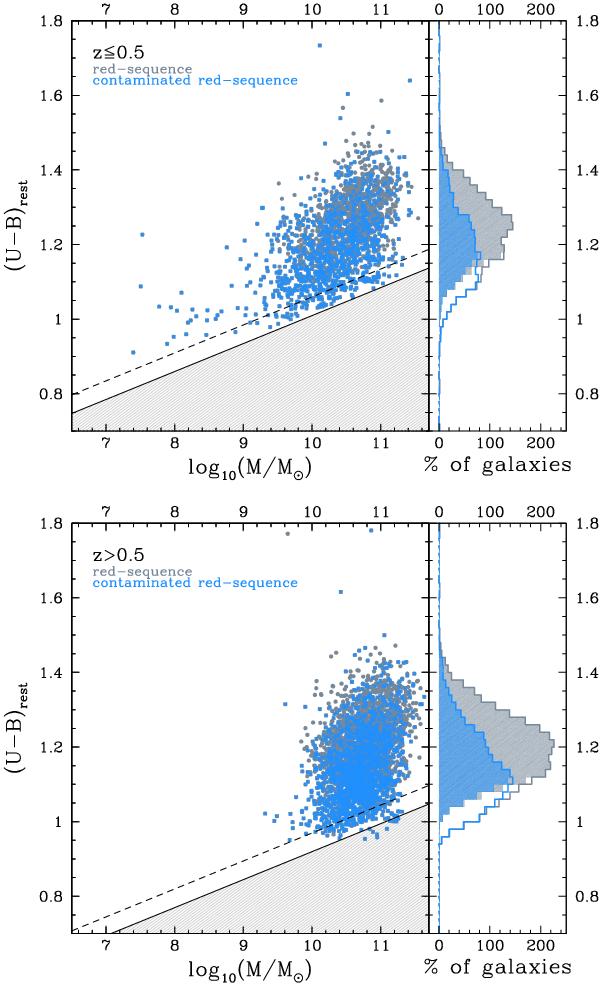
(U − B)rest-mass diagram. In gray is shown the original (U − B)rest-mass criterion as defined by Peng et al. (2010), and in cyan are highlighted the galaxies presenting a sSFR or emission lines in excess with respect to the passive cuts. The empty cyan histograms show the distribution of the contaminants with the old definitions, while the shaded cyan histograms show the distribution of the contaminants with the new selection criterion as defined in Sect. 4.5. The upper plot shows the diagram obtained for z ≤ 0.5, and the lower plot shows the diagram obtained for z > 0.5.
Current usage metrics show cumulative count of Article Views (full-text article views including HTML views, PDF and ePub downloads, according to the available data) and Abstracts Views on Vision4Press platform.
Data correspond to usage on the plateform after 2015. The current usage metrics is available 48-96 hours after online publication and is updated daily on week days.
Initial download of the metrics may take a while.