Fig. 12
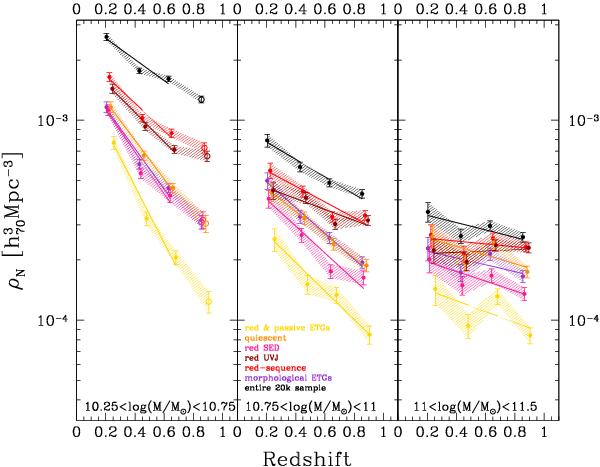
Redshift evolution of the galaxy number density, derived using 1/Vmax, for three different mass ranges: 10.25 < log (M/M⊙) < 10.75 (left panel), 10.75 < log (M/M⊙) < 11 (central panel) and log (M/M⊙) > 11 (right panel). The different colors represent different selection criteria (violet for the morphological ETGs, light red for the red-sequence galaxies, dark red for the red UVJ galaxies, pink for the red SED galaxies, orange for the quiescent galaxies, and yellow for the red & passive ETGs). The lines represent the fit to the observed log (ρN(z)) relation. The open points represent the lower limits where the survey is not complete.
Current usage metrics show cumulative count of Article Views (full-text article views including HTML views, PDF and ePub downloads, according to the available data) and Abstracts Views on Vision4Press platform.
Data correspond to usage on the plateform after 2015. The current usage metrics is available 48-96 hours after online publication and is updated daily on week days.
Initial download of the metrics may take a while.