Fig. 11
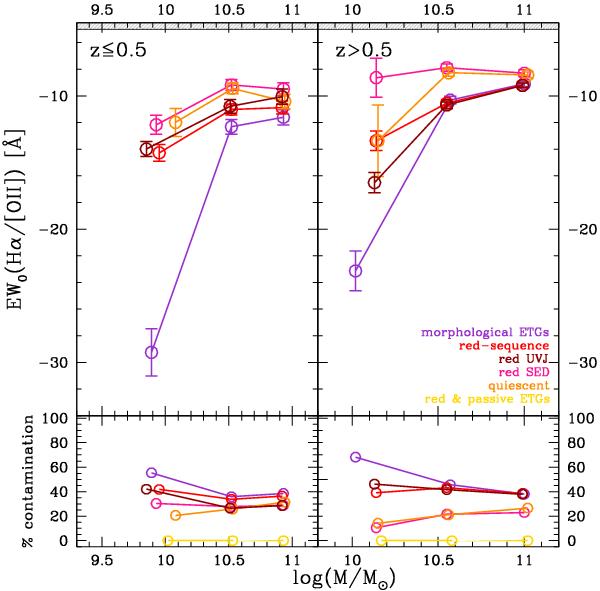
Median EW0(Hα) (upper panel; EW0( [OII]) if z > 0.5) and relative percentage (lower panel) as a function of stellar mass of galaxies with significant emission lines, i.e., EW0(Hα) > 5 Å (if z ≤ 0.5) and EW0( [OII] ) > 5 Å (if z > 0.5), for the different selection criteria (in violet the morphological ETGs, in light red the red-sequence galaxies, in dark red the red UVJ galaxies, in pink the red SED galaxies, in orange the quiescent galaxies, and in yellow the red & passive ETGs). The errorbars represent the error on the median. By convention, the emission lines are quoted with negative values.
Current usage metrics show cumulative count of Article Views (full-text article views including HTML views, PDF and ePub downloads, according to the available data) and Abstracts Views on Vision4Press platform.
Data correspond to usage on the plateform after 2015. The current usage metrics is available 48-96 hours after online publication and is updated daily on week days.
Initial download of the metrics may take a while.