Fig. 6
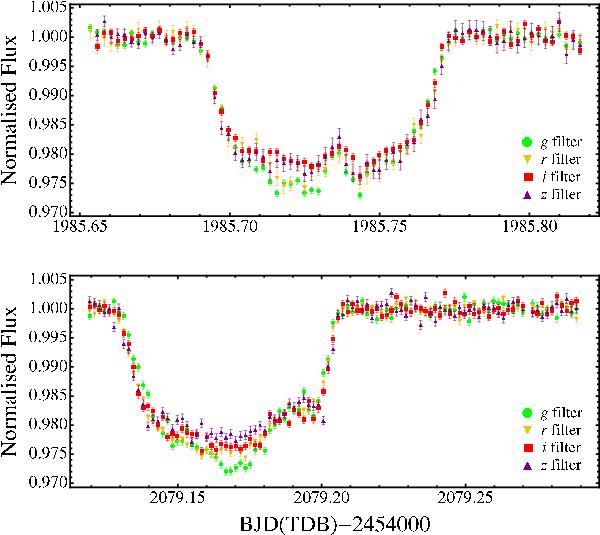
Combined four-color transit light curves of HATS-2 obtained with the GROND imaging system. Green dots are for the data taken in the g band, yellow upside-down triangles for the r band, red squares for the i band, and purple triangles for the z band. Top panel: transit observed on February 28, 2012. The bump observed just after the midtransit is interpreted as the covering of a “cold” starspot by the planet. Lower panel: transit observed on June 1, 2012. In addition to the bump occurred near the egress part of the light curve, a “hot” spot manifested in the g band, just before the start of the covering of the starspot.
Current usage metrics show cumulative count of Article Views (full-text article views including HTML views, PDF and ePub downloads, according to the available data) and Abstracts Views on Vision4Press platform.
Data correspond to usage on the plateform after 2015. The current usage metrics is available 48-96 hours after online publication and is updated daily on week days.
Initial download of the metrics may take a while.