Fig. 2
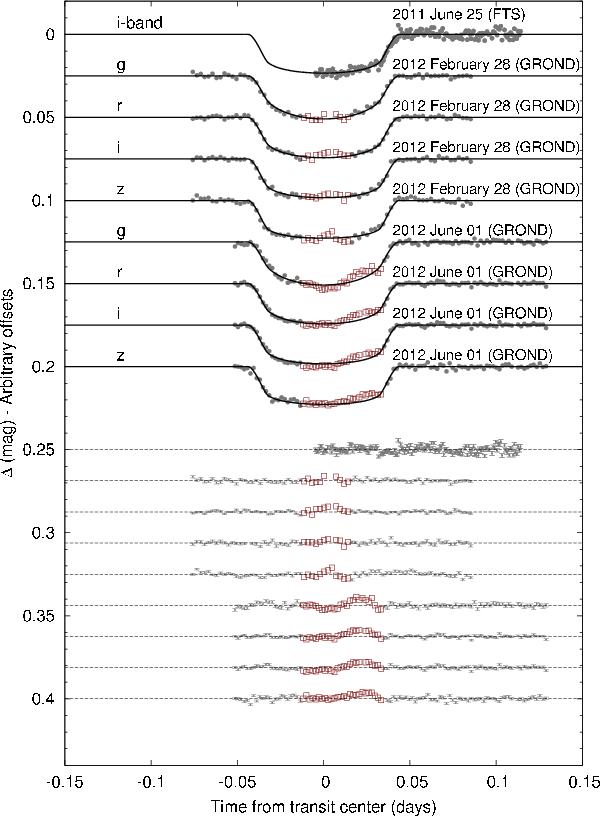
Phased transit light curves of HATS-2. The dates and instruments used for each event are indicated. The light curves are ordered according to the date and to the central wavelength of the filter used (Sloan g, r, i and z). Our best fit is shown by the solid lines (see Sect. 3.4). Residuals from the fits are displayed at the bottom, in the same order as the top curves. The GROND datapoints affected by anomalies are marked with red empty squares and were not considered in estimating the final values of the planetary-system parameters (see Sect. 4).
Current usage metrics show cumulative count of Article Views (full-text article views including HTML views, PDF and ePub downloads, according to the available data) and Abstracts Views on Vision4Press platform.
Data correspond to usage on the plateform after 2015. The current usage metrics is available 48-96 hours after online publication and is updated daily on week days.
Initial download of the metrics may take a while.