Fig. 1
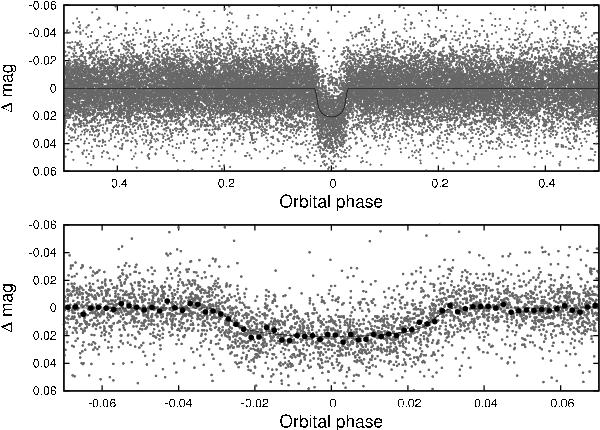
Top panel: unbinned instrumental r-band light curve of HATS-2 folded with the period P = 1.354133 days resulting from the global fit described in Sect. 3. Lower panel: zoom-in on the transit; the dark filled points show the light curve binned in phase using a bin size of 0.002. In both panels, the solid line shows the best-fit transit model (see Sect. 3.4).
Current usage metrics show cumulative count of Article Views (full-text article views including HTML views, PDF and ePub downloads, according to the available data) and Abstracts Views on Vision4Press platform.
Data correspond to usage on the plateform after 2015. The current usage metrics is available 48-96 hours after online publication and is updated daily on week days.
Initial download of the metrics may take a while.