Fig. 9
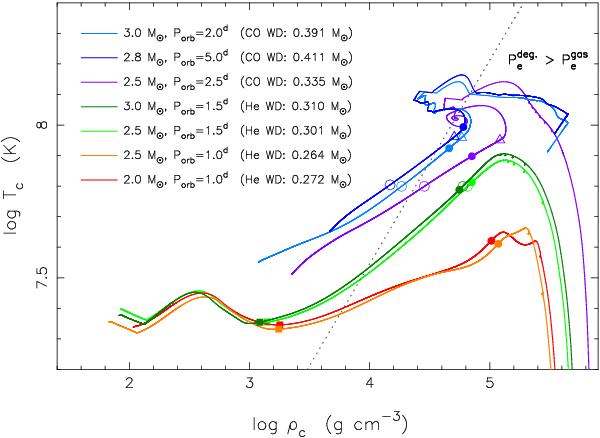
Evolutionary tracks in the core density-core temperature (ρc,Tc)-plane. For each graph the initial (ZAMS) values of the donor star mass, M2, the orbital period, Porb, and in parenthesis the main chemical composition and the mass of the final WD are listed. The dotted line separates regions where the stellar pressure is dominated by the gas pressure (left) and the degenerate electron pressure (right). On each track the symbols represent: the termination of core hydrogen burning (filled squares), the end of the RLO (filled circles), the onset of the 3α-process (open circles) and the onset of efficient helium burning (i.e. when the luminosity generated by the 3α–process exceeds the energy loss rate by neutrinos, open triangles). The calculations were followed to the WD cooling track, except for two cases causing numerical instabilities during hydrogen shell flashes.
Current usage metrics show cumulative count of Article Views (full-text article views including HTML views, PDF and ePub downloads, according to the available data) and Abstracts Views on Vision4Press platform.
Data correspond to usage on the plateform after 2015. The current usage metrics is available 48-96 hours after online publication and is updated daily on week days.
Initial download of the metrics may take a while.