Fig. 7
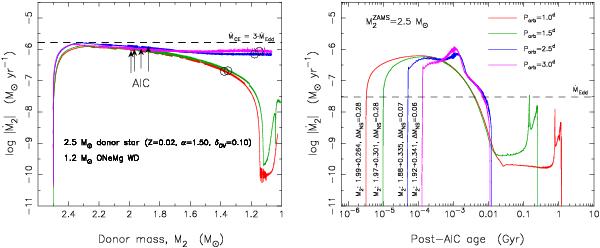
Left panel: mass-transfer rates of four 2.5 M⊙ donor stars in pre-AIC binaries with initial orbital periods between 1.0 − 3.0 days leading to the post-AIC LMXB systems shown in the right panel. The arrows mark the collapse of the accreting WD (AIC) and the evolution from this point onwards can be ignored since it is now followed in the post-AIC LMXB systems shown in the right panel. The dashed line is the adopted upper limit for stable mass transfer (see Sect. 3.1.1). It is seen how the pre-AIC mass-transfer rates were quite close to our accepted upper limit. A slightly more massive donor star would lead to excessive mass-transfer rates and thus not result in an AIC event (see also the systematic effect of an increasing donor mass in Fig. 5). The open circles indicate hypothetical super-Chandrasekhar WD masses of 2.0 M⊙. Right panel: mass-transfer rates of the post-AIC LMXBs plotted as a function of time since the AIC event. The reason for the difference in time intervals between the AIC event and the donor stars refilling their Roche lobe (see initial interceptions of the four graphs with the x-axis) is mainly due to different expansions of the orbit due to the AIC event, caused by different Porb at the moment of the WD collapse. The vertical text at the lower left side of each graph yields the mass of the donor star at the moment of the AIC, the mass of the final WD following the LMXB and the amount of mass accreted by the NS, ΔMNS. The dashed line is the Eddington accretion limit for a NS. Only the systems with initial pre-AIC orbital periods of 1.0 days (red curve) and 1.5 days (green curve) experienced a long phase (>100Myr) of post-AIC mass-transfer driven by hydrogen shell burning. This phase leads to significant accretion onto the NS (and effective recycling) since |Ṁ2| < ṀEdd. Hence, the NSs in these systems were able to accrete more mass which results in faster spinning MSPs (partly due to their smaller magnetospheres).
Current usage metrics show cumulative count of Article Views (full-text article views including HTML views, PDF and ePub downloads, according to the available data) and Abstracts Views on Vision4Press platform.
Data correspond to usage on the plateform after 2015. The current usage metrics is available 48-96 hours after online publication and is updated daily on week days.
Initial download of the metrics may take a while.