Fig. 10
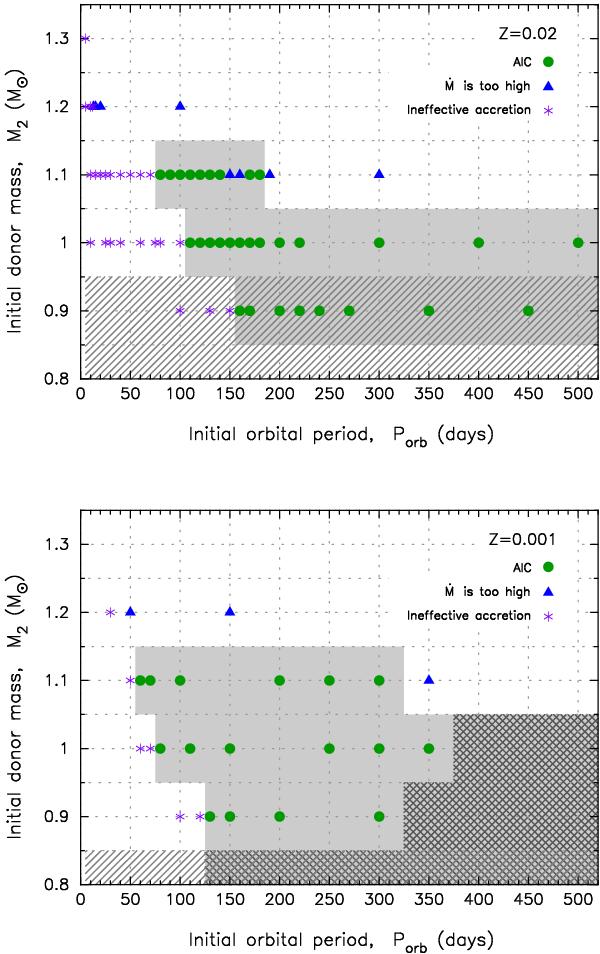
Grid of investigated initial orbital periods and masses for giant star donors with a metallicity of Z = 0.02 (top) and Z = 0.001 (bottom). The meaning of the various symbols is equivalent to those in Fig. 3. The grey shaded region in each panel corresponds to systems which successfully evolve to the AIC stage. Only giant donors with masses 0.9 ≤ M2/ M⊙ ≤ 1.1 are able to produce MSPs via the AIC channel. The hatched regions indicate donor stars which evolve on a timescale longer than the Hubble-timescale. The cross-hatched region corresponds to giant donors which have so large atmospheric, hydrogen pressure scale-heights that our adopted mass-transfer scheme breaks down – see text.
Current usage metrics show cumulative count of Article Views (full-text article views including HTML views, PDF and ePub downloads, according to the available data) and Abstracts Views on Vision4Press platform.
Data correspond to usage on the plateform after 2015. The current usage metrics is available 48-96 hours after online publication and is updated daily on week days.
Initial download of the metrics may take a while.