Fig. 9
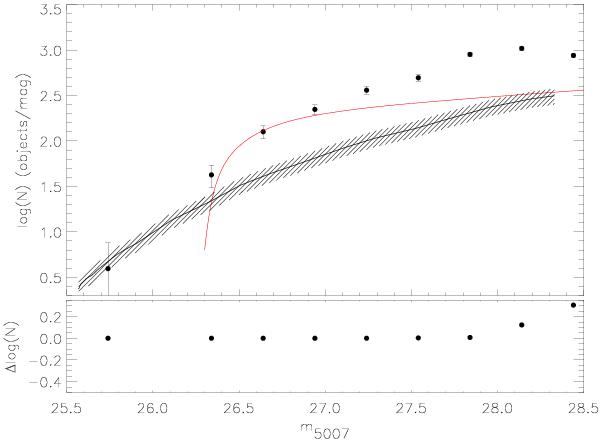
Top panel: luminosity function of the selected PNs in the outer regions of M 87, corrected for colour and detection incompleteness. The error bars show the 1σ uncertainty from counting statistics. Data are binned into 0.3 mag intervals (see Table 5 for numerical values). The solid red line represents the analytical PNLF model for a distance modulus of 30.8, convolved with photometric errors. The black line shows the Lyα LF from Gronwall et al. (2007), scaled to the effective surveyed volume of the M 87 SUB1 and M 87 SUB2 fields, with the shaded area showing the cosmic variance due to Lyα density fluctuations (~20%, see Sect. 3.2). Bottom panel: difference between the PNLF if we had used instead the automatically extracted sources without any final inspection. This plot shows that spurious detections affect mostly the two faintest magnitude bins.
Current usage metrics show cumulative count of Article Views (full-text article views including HTML views, PDF and ePub downloads, according to the available data) and Abstracts Views on Vision4Press platform.
Data correspond to usage on the plateform after 2015. The current usage metrics is available 48-96 hours after online publication and is updated daily on week days.
Initial download of the metrics may take a while.