Free Access
Fig. 1

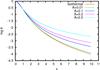
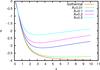
Normalized density profiles θ = ρ/ρc (left panel) and values of α (right panel; see Sect. 3.1 for the definition of α) as a function of x = r/H for models with temperature profiles as described by Eq. (8) for different normalized temperature gradients A. The reference isothermal profile is also plotted in both panels.
This figure is made of several images, please see below:
Current usage metrics show cumulative count of Article Views (full-text article views including HTML views, PDF and ePub downloads, according to the available data) and Abstracts Views on Vision4Press platform.
Data correspond to usage on the plateform after 2015. The current usage metrics is available 48-96 hours after online publication and is updated daily on week days.
Initial download of the metrics may take a while.