Fig. 5
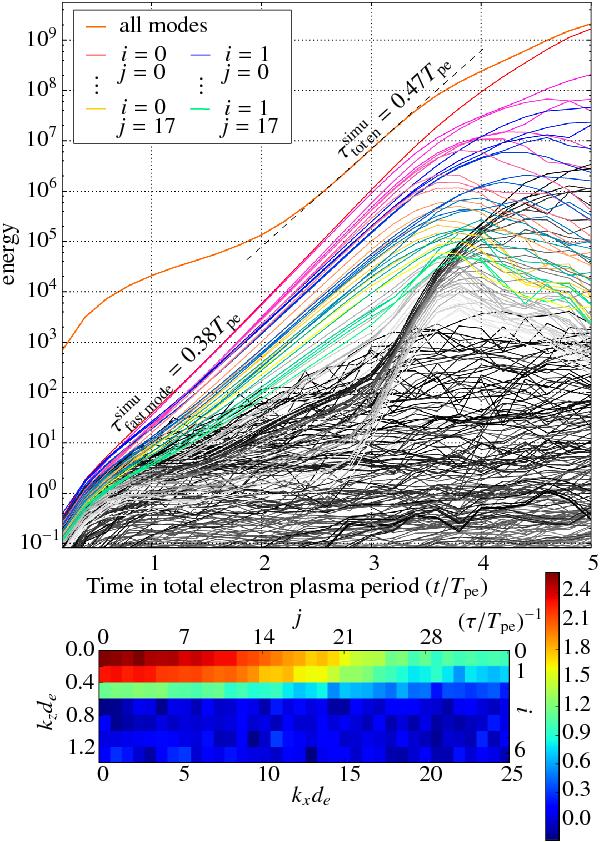
Top: growth of individual Fourier modes for bx (for the run labeled Fig. 4 in Table 3). The modes shown are those for i = 0,1,2, and j = 0,1,...,25, and one mode every 100 modes for the remaining. We note that the graphic has been cut and that the weak modes actually fill a continuum down to an energy of 10-7. The sum of all 320 × 90 modes is shown in orange. We recall that mode (i,j) corresponds to (kzde,kxde) = 2π × 20(i/640,j/180). Bottom: growth map of the Fourier modes, in units of Tpe.
Current usage metrics show cumulative count of Article Views (full-text article views including HTML views, PDF and ePub downloads, according to the available data) and Abstracts Views on Vision4Press platform.
Data correspond to usage on the plateform after 2015. The current usage metrics is available 48-96 hours after online publication and is updated daily on week days.
Initial download of the metrics may take a while.