Fig. 9
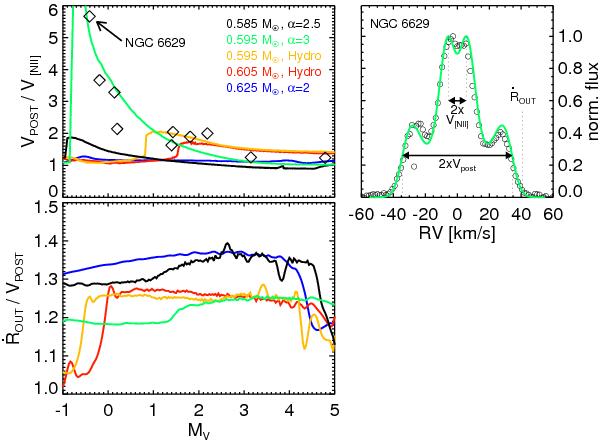
Evolution of corrections factors. Top left panel: the theoretically
predicted variations of
Vpost/V[N ii]
with absolute stellar magnitude, MV, are
compared with observationally determined values of Vpost
and V[N ii] for PNe for which both velocities
are known (see Table A.1). The maximum value of
Vpost/V[N ii]
is 7.1 right after the thick/thin transition of the 0.595
M⊙ “α = 3” model sequence.
Bottom panel: here the ratio
 vs. absolute stellar magnitude is plotted for the same simulations shown in the
top left panel. Top right: observed line profile
of [N ii] λ 6583 Å (circles) of the PN NGC 6629 (No. 196), taken from Paper II compared to a
theoretical profile computed from a model of the 0.595 M⊙
“α = 3” sequence, convolved with a Gaussian of 10 km s-1
FWHM. This model corresponds closely to the position of NGC 6629 in the top left panel, and its parameters are the following:
Teff = 46 800 K, (post-AGB) age = 3968 yr, and
MV = −0.58,
V[N ii] = 5.6 km s-1, and
Vpost = 34.4 km s-1. Observed values are
Teff = 47 000 K (Méndez et al. 1988),
MV = −0.41,
V[N ii] = 6 km s-1, and
Vpost = 34 km s-1 (see Table A.1, No. 196). The vertical dotted line indicates
the shock velocity of the model, Ṙout = 41
km s-1.
vs. absolute stellar magnitude is plotted for the same simulations shown in the
top left panel. Top right: observed line profile
of [N ii] λ 6583 Å (circles) of the PN NGC 6629 (No. 196), taken from Paper II compared to a
theoretical profile computed from a model of the 0.595 M⊙
“α = 3” sequence, convolved with a Gaussian of 10 km s-1
FWHM. This model corresponds closely to the position of NGC 6629 in the top left panel, and its parameters are the following:
Teff = 46 800 K, (post-AGB) age = 3968 yr, and
MV = −0.58,
V[N ii] = 5.6 km s-1, and
Vpost = 34.4 km s-1. Observed values are
Teff = 47 000 K (Méndez et al. 1988),
MV = −0.41,
V[N ii] = 6 km s-1, and
Vpost = 34 km s-1 (see Table A.1, No. 196). The vertical dotted line indicates
the shock velocity of the model, Ṙout = 41
km s-1.
Current usage metrics show cumulative count of Article Views (full-text article views including HTML views, PDF and ePub downloads, according to the available data) and Abstracts Views on Vision4Press platform.
Data correspond to usage on the plateform after 2015. The current usage metrics is available 48-96 hours after online publication and is updated daily on week days.
Initial download of the metrics may take a while.