Fig. 7
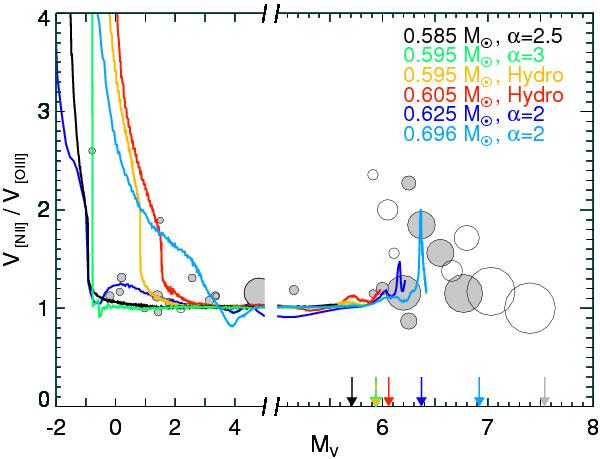
Predicted variations of F = V[N ii]/V[O iii] with stellar absolute magnitude are compared with measurements of the V[N ii] and V[O iii] velocities listed in Table A.1. The abscissa is expanded for MV ≥ 5 for more clarity. The model sequences used are indicted in the legend. Evolution proceeds from left to right, and the limiting stellar magnitudes reached after 25 000 years of evolution are indicated along the abscissa by the (coloured) vertical arrows. For comparison, the grey vertical arrow at MV = 7.55 belongs to a 0.94 M⊙ post-AGB model. The size of the symbols corresponds to the nebular radius: from the smallest objects, 0.03 pc (NGC 7027, No. 46, and NGC 6567, No. 146) to the largest, 1.09 pc (PuWe 1, No. 5). Smaller objects are a bit enlarged for a better visibility, but the size relations are kept qualitatively. Open symbols have distances D ≤ 1 kpc, filled symbols have D > 1 kpc. The typical error of the stellar brightness is, due to the distance uncertainty, about ± 0.5 dex.
Current usage metrics show cumulative count of Article Views (full-text article views including HTML views, PDF and ePub downloads, according to the available data) and Abstracts Views on Vision4Press platform.
Data correspond to usage on the plateform after 2015. The current usage metrics is available 48-96 hours after online publication and is updated daily on week days.
Initial download of the metrics may take a while.