Fig. 5
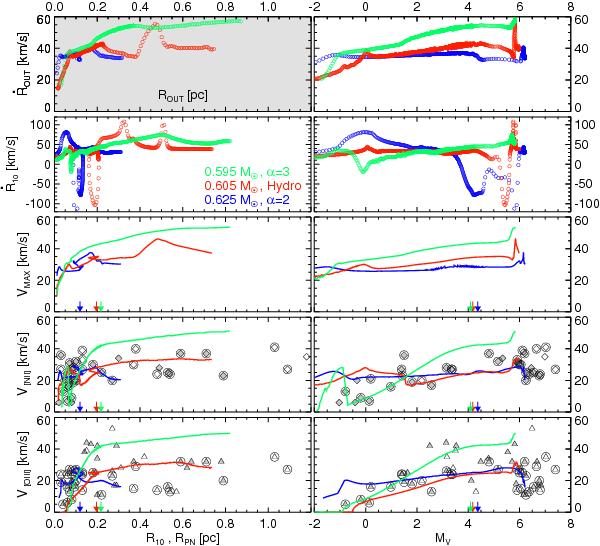
Plots of different types of “expansion” velocities, observed/modelled, over nebular radius, RPN, R10, or Rout (left) and central-star absolute magnitude, MV, of observations/models (right). Velocities of the leading edge, Ṙout (top row) and of the Hα 10% isophote, Ṙ10 (second row) as predicted by the models. Without any loss of information, velocities for only three model sequences are plotted, 0.595 M⊙ “α = 3”, 0.605 M⊙ “hydro”, and 0.625 M⊙ “α = 2”, for more clarity. The top left panel is grey because it is the only one with the true model radius, Rout, as abscissa. Note also the extended velocity range belonging to the panels in the second row. The evolution through the loops in the left panel, second row occurs clockwise. Third row: maximum gas velocities,Vmax, within the model nebulae from the selected sequences (see text for details). The vertical arrows on the abscissae mark the nebular radii or stellar brightness where the central star models reach their maximum effective temperatures. These arrows separate between younger models (and objects) with luminous central stars and older ones with faint central stars. Up to this stage Vmax corresponds in all models to the post-shock velocity, Vpost. Fourth and bottom rows: peak-separation velocities V[N ii] and V[O iii], as they follow from central line-of-sight line profiles computed from the models (solid lines) and measured (symbols), as given in Table A.1, respectively. The sample of Table A.1 is again boken-down into open symbols (D ≤ 1 kpc) and filled symbols (D > 1 kpc). Circles around symbols indicate objects for which we have velocities from both nitrogen and oxygen ions. Zero model velocities mean that the line is not split at an assumed instrumental resolution of 10 km s-1.
Current usage metrics show cumulative count of Article Views (full-text article views including HTML views, PDF and ePub downloads, according to the available data) and Abstracts Views on Vision4Press platform.
Data correspond to usage on the plateform after 2015. The current usage metrics is available 48-96 hours after online publication and is updated daily on week days.
Initial download of the metrics may take a while.