Fig. 4
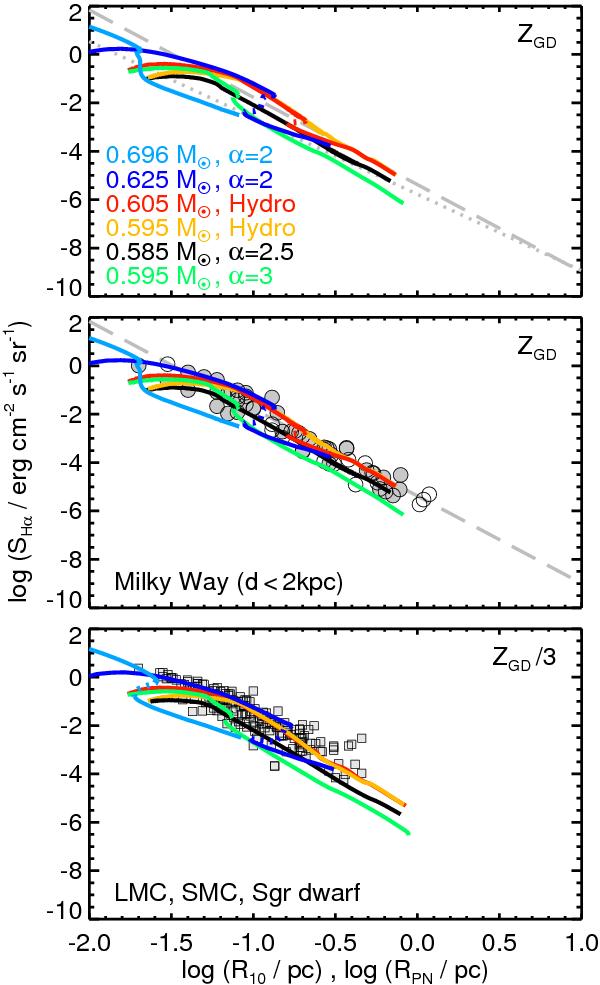
The Hα surface brightness, SHα, as observed and computed from models versus observed/modelled radius. Top panel: run of Hα surface brightness over R10 as predicted by our 1D-radiation-hydrodynamics simulations with various central stars and different initial configurations as indicated in the legend. The model sequences are labeled by the central-star masses and are described in detail in Paper I and Paper II. “Hydro” stands for hydrodynamical modelling of dusty AGB wind envelopes along the final AGB evolution, and “α” is the exponent of a much simpler power-law density distribution for the initial circumstellar neutral shells. Models are plotted for central stars hotter than 20 000 K until end of simulations. The starting point for the 0.696 M⊙ sequence is outside the graph at R10 = 0.002 pc. The non-monotonic behaviour of SHα is due to recombination occurring in the models with more massive nuclei. The dotted parts of some sequences emphasise this brief phase of decreasing R10. The metallicity of the nebular models, ZGD is given in Table 1.The thick dashed line indicates the recent calibration by Frew & Parker (2006) and Frew (2008,Eq. (7.1) therein), based on 122 carefully selected calibrating sources. The thick dotted line represents Frew’s (2008) calibration of objects with high nebular excitation, defined by the condition that the λ4686 Å flux is at least 75% of the Hβ flux (Frew’s Eq. (7.8)). Middle panel: models compared with PNe data from Table A.1. The PNe sample is broken down into objects with distances ≤1 kpc (open symbols) and >1 kpc (filled symbols). Bottom panel: the same models as shown in the top panel, but with down-scaled metallicity ZGD/3, and compared to Magellanic Clouds and Sgr dwarf spheroidal galaxy PNe (from Fig. 7.18 in Frew 2008).
Current usage metrics show cumulative count of Article Views (full-text article views including HTML views, PDF and ePub downloads, according to the available data) and Abstracts Views on Vision4Press platform.
Data correspond to usage on the plateform after 2015. The current usage metrics is available 48-96 hours after online publication and is updated daily on week days.
Initial download of the metrics may take a while.