Fig. 10
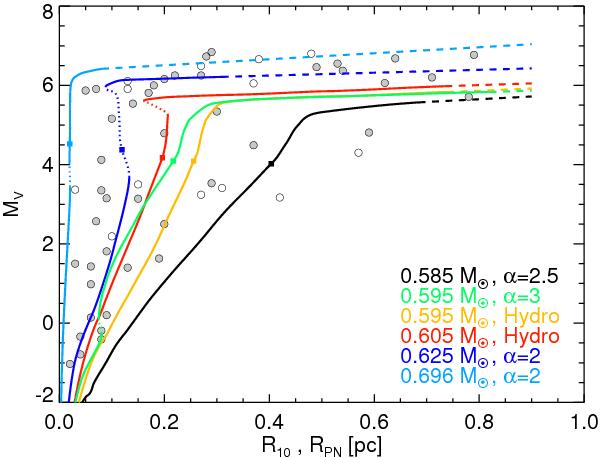
Observed and computed stellar absolute magnitudes, MV, vs. observed/modelled radii, RPN, R10. The model sequences shown are indicated in the legend, and the symbols refer to all objects from Table A.1, again broken up into local objects (distance ≤1 kpc, open) and those with distance >1 kpc (filled). Evolution goes from the lower left corner towards the upper right corner. The dotted parts of the model tracks (0.696, 0.625, and 0.605 M⊙ “hydro” only) indicate strong recombination with a reduction of R10 (cf. discussion in Sect. 3.2). The different slopes of the model sequences correspond mainly to the speed of stellar evolution, modified by the nebular expansion properties. The coloured squares mark the position of maximum stellar temperature and hence divide the sequences into the high-luminosity and low-luminosity parts. Dashed lines indicate that the evolution has been extrapolated assuming conservatively that the shock propagation of the last computed model remains constant.
Current usage metrics show cumulative count of Article Views (full-text article views including HTML views, PDF and ePub downloads, according to the available data) and Abstracts Views on Vision4Press platform.
Data correspond to usage on the plateform after 2015. The current usage metrics is available 48-96 hours after online publication and is updated daily on week days.
Initial download of the metrics may take a while.