Fig. 5
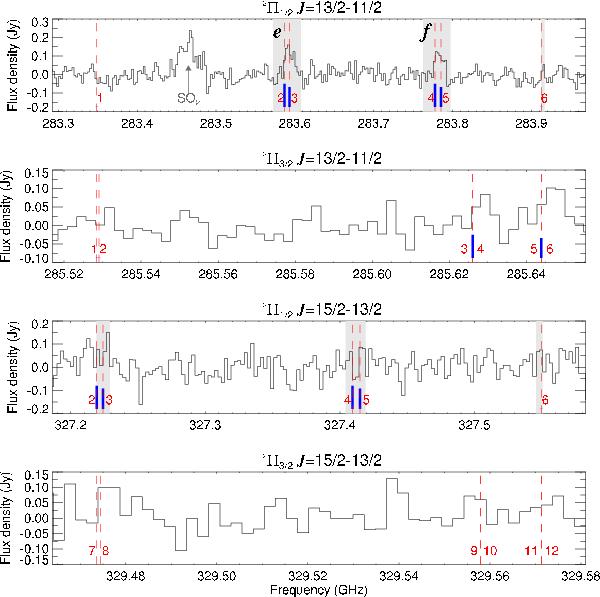
Parts of the SMA survey spectrum corresponding to transitions of PO, ordered according to increasing frequency from top to bottom. All components are indicated as they appear in the last column of Table 2. Their theoretical intensities, relative to the strongest within the given spin component of the rotational transition, are indicated by the height of the blue bars. Note that the model predictions for some components are too weak to be plotted. The frequency ranges integrated to obtain the line fluxes used in the rotational diagram and listed in Table 3 are indicated with the grey-shaded areas. The Λ components presented in Fig. 6 are labelled with e and f in the top panel. Component 1 of the  transition is not shown since it falls in a high-noise region of the spectrum. The top panel shows the contribution of the SO2(160,16 − 151,15) transition at 283.465 GHz.
Current usage metrics show cumulative count of Article Views (full-text article views including HTML views, PDF and ePub downloads, according to the available data) and Abstracts Views on Vision4Press platform.
Data correspond to usage on the plateform after 2015. The current usage metrics is available 48-96 hours after online publication and is updated daily on week days.
Initial download of the metrics may take a while.