Fig. A.2
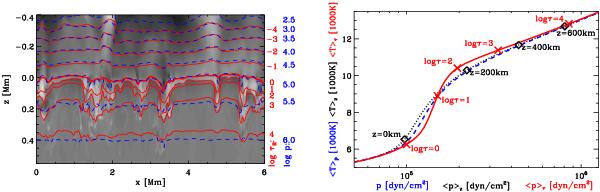
Illustration of the different averages. Left panel: vertical cut through a part of the G2V simulation domain. Surfaces of constant optical depth (solid, red curves) and constant pressure (dashed, blue curves) are indicated; the underlying grey-scale image illustrate the density (normalised by the horizontal mean ⟨ϱ⟩z). Right panel: run of the horizontally averaged temperature vs. averaged pressure in the G2V simulation for the different averages ⟨ · ⟩ z (dotted, black), ⟨ · ⟩ τ (red, solid), and ⟨ · ⟩ p (blue, dashed); as a reference the position of some z and τ values is marked.
Current usage metrics show cumulative count of Article Views (full-text article views including HTML views, PDF and ePub downloads, according to the available data) and Abstracts Views on Vision4Press platform.
Data correspond to usage on the plateform after 2015. The current usage metrics is available 48-96 hours after online publication and is updated daily on week days.
Initial download of the metrics may take a while.