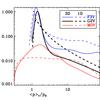
Fig. 15
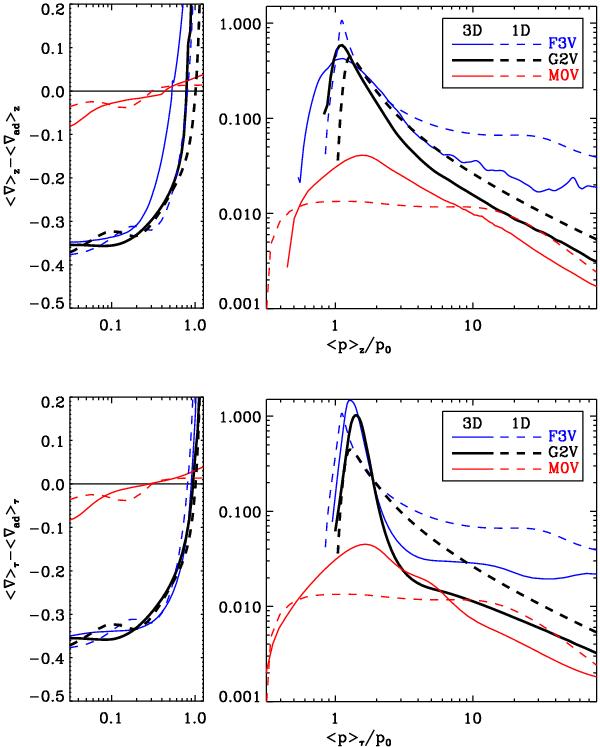
Comparison of the superadiabaticity of the 3D MURaM simulations with 1D MLT models. Top: 3D results averaged on planes of constant geometrical depth, z. Botom: 3D results averaged on iso-τR surfaces. The left subplots show the superadiabaticity of the atmospheric layers on a linear scale, the right subplots show the superadiabatic regime on a logarithmic scale. In the 1D models, the mixing-length parameter α was set to 1.5, 1.7, and 2.0 for F3V, G2V, and M0V, respectively.
Current usage metrics show cumulative count of Article Views (full-text article views including HTML views, PDF and ePub downloads, according to the available data) and Abstracts Views on Vision4Press platform.
Data correspond to usage on the plateform after 2015. The current usage metrics is available 48-96 hours after online publication and is updated daily on week days.
Initial download of the metrics may take a while.