Fig. 2
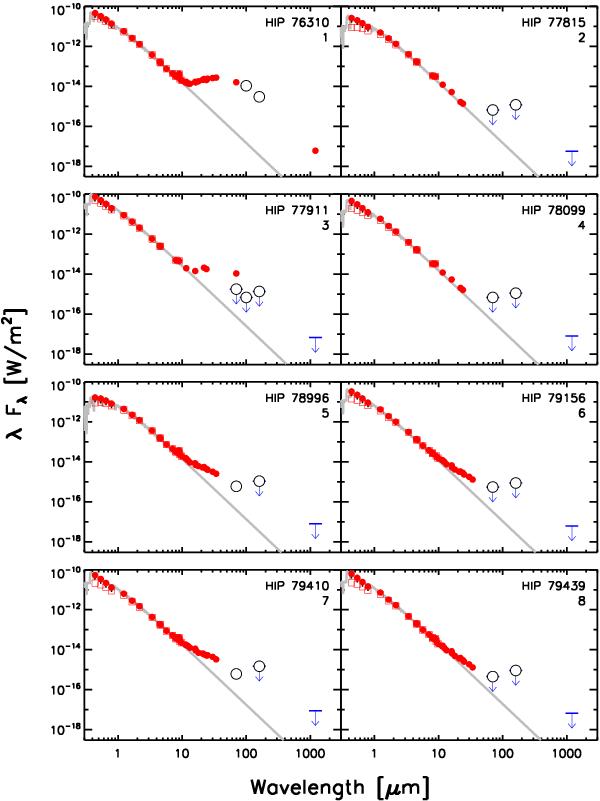
Spectral energy distributions for Upper Sco sources. Dereddened photometry is shown as red circles, while original data is shown as open red squares. PACS photometry is marked with open black circles, and 3σ upper limits are shown as flat lines with downward facing arrows. Stellar photospheres are shown as gray lines. We have omitted upper limits when they have been superseded by a new observation at the same wavelength. HIP 77911 is not detected in PACS photometry. 70 and 100 μm emission is detected at the location of a nearby companion (8′′), suggesting past photometry may originate at that source.
Current usage metrics show cumulative count of Article Views (full-text article views including HTML views, PDF and ePub downloads, according to the available data) and Abstracts Views on Vision4Press platform.
Data correspond to usage on the plateform after 2015. The current usage metrics is available 48-96 hours after online publication and is updated daily on week days.
Initial download of the metrics may take a while.