Fig. B.1
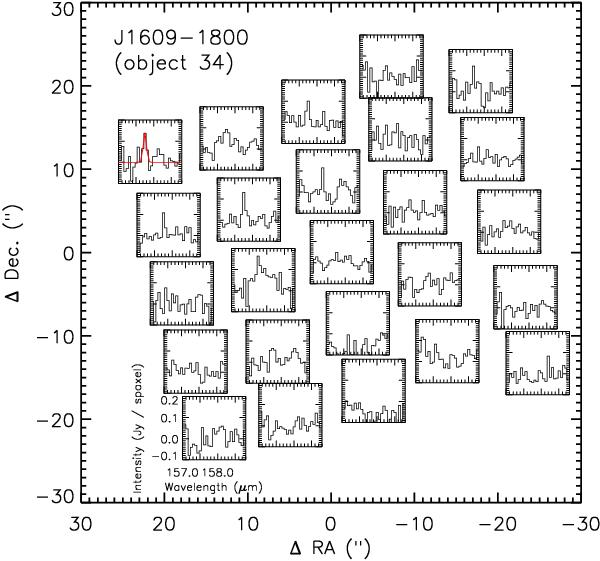
Footprint continuum-subtracted spectra of [CII] 157.7 μm emission toward object 34, without aperture correction. Each box is centered at the reported position of the spaxel for the observation. Red lines show Gaussian fits to spectra which are detected at the 3σ level or higher (typical limit is ~ 2.5 × 10⁻¹⁸ W m-2 per spaxel). Additional spaxels may have emission at ~ 2σ level.
Current usage metrics show cumulative count of Article Views (full-text article views including HTML views, PDF and ePub downloads, according to the available data) and Abstracts Views on Vision4Press platform.
Data correspond to usage on the plateform after 2015. The current usage metrics is available 48-96 hours after online publication and is updated daily on week days.
Initial download of the metrics may take a while.