Fig. 2
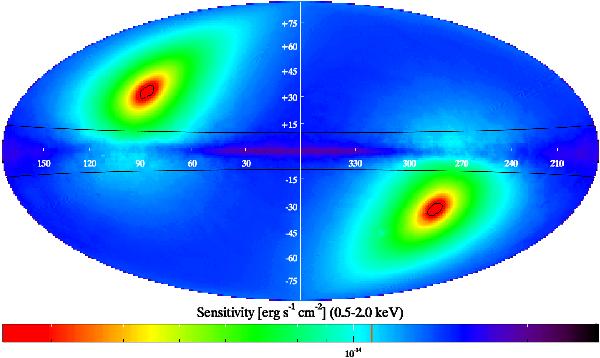
Four-year soft-band sensitivity map of eRASS in Galactic coordinates (l, b), based on the exposure time map of J. Robrade (priv. comm.) for a continuous Sun-pointing and based on the NH-map of Kalberla et al. (2005). The two black horizontal curves enclose the Galactic plane (|b| < 10°), which is excluded from our calculation, and the two regions encircled by black curves are our defined ecliptic poles, where the exposure time was set to 20.0ks. The red vertical line in the horizontal color bar shows the average sensitivity (from Table 2).
Current usage metrics show cumulative count of Article Views (full-text article views including HTML views, PDF and ePub downloads, according to the available data) and Abstracts Views on Vision4Press platform.
Data correspond to usage on the plateform after 2015. The current usage metrics is available 48-96 hours after online publication and is updated daily on week days.
Initial download of the metrics may take a while.