Fig. 6
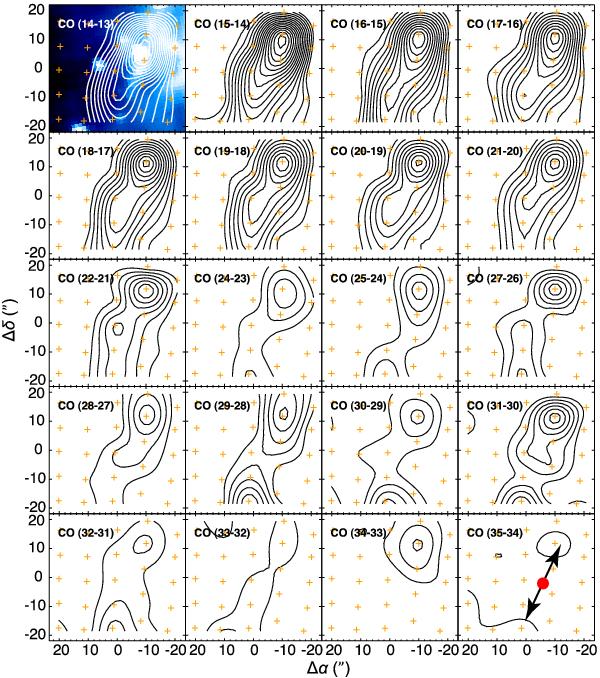
Spectral line maps of the J = 14–13 up to J = 35–34 CO transitions around SMM3. All CO line maps presented show emission extending to the NNW and SSE from the exciting source near the center of each panel with a strong peak towards the NW. The CO J = 23–22 transition is blended with the stronger H2O(414–303) line and is therefore presented in Fig. 8. The enhancement in the J = 31–30 map is due to blending with the OH (3/2–3/2, 7/2+–5/2−) line. A 4.5 μm Spitzer/IRAC image is presented as background on the upper left panel; bright regions correspond to H2 emission, which is spatially coincident with the CO peak. The filled circle and arrows in the lower-right panel display the position of the source (Harvey et al. 2007) and the direction of the outflows (Dionatos et al. 2010b). Contour levels are from 10-14 erg cm-2 s-1 and increase by steps of 10-14 erg cm-2 s-1 (~3-sigma of the weakest transitions).
Current usage metrics show cumulative count of Article Views (full-text article views including HTML views, PDF and ePub downloads, according to the available data) and Abstracts Views on Vision4Press platform.
Data correspond to usage on the plateform after 2015. The current usage metrics is available 48-96 hours after online publication and is updated daily on week days.
Initial download of the metrics may take a while.