Fig. 5
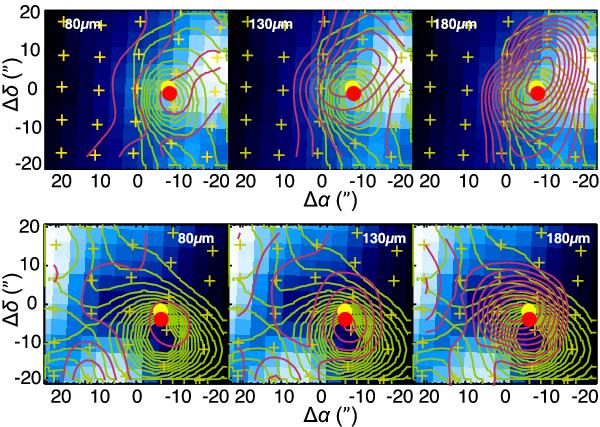
PACS continuum levels at 80, 130 and 180 μm (red contours) superimposed on a Spitzer/MIPS 70 μm images around SMM3 and SMM4 (upper and lower panels, respectively). Green contours show the 450 μm continuum observed with SCUBA, while the yellow and red dots depict the position of the sources reported in Harvey et al. (2007) and Hogerheijde et al. (1999). PACS and SCUBA levels start at 2 Jy and increase by 2 Jy and 1.5 Jy steps, respectively.
Current usage metrics show cumulative count of Article Views (full-text article views including HTML views, PDF and ePub downloads, according to the available data) and Abstracts Views on Vision4Press platform.
Data correspond to usage on the plateform after 2015. The current usage metrics is available 48-96 hours after online publication and is updated daily on week days.
Initial download of the metrics may take a while.