Fig. 20
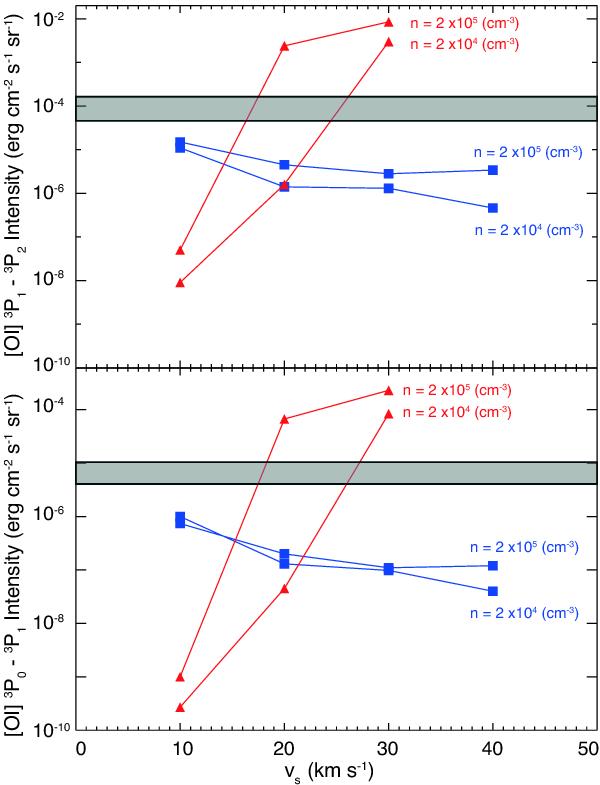
Minimum and maximum observed [OI] line intensities over all positions for the 3P1–3P2 and the 3P0–3P1 transitions (upper and lower panels, respectively) versus shock velocity for C- (blue) and J-type shocks (red) from FPDF’10. The shaded area indicates the observed upper and lower line intensity limits. Observed intensities intercept only the J-shock predictions, constraining the shock velocities to 15–25 km s-1.
Current usage metrics show cumulative count of Article Views (full-text article views including HTML views, PDF and ePub downloads, according to the available data) and Abstracts Views on Vision4Press platform.
Data correspond to usage on the plateform after 2015. The current usage metrics is available 48-96 hours after online publication and is updated daily on week days.
Initial download of the metrics may take a while.