Fig. 15
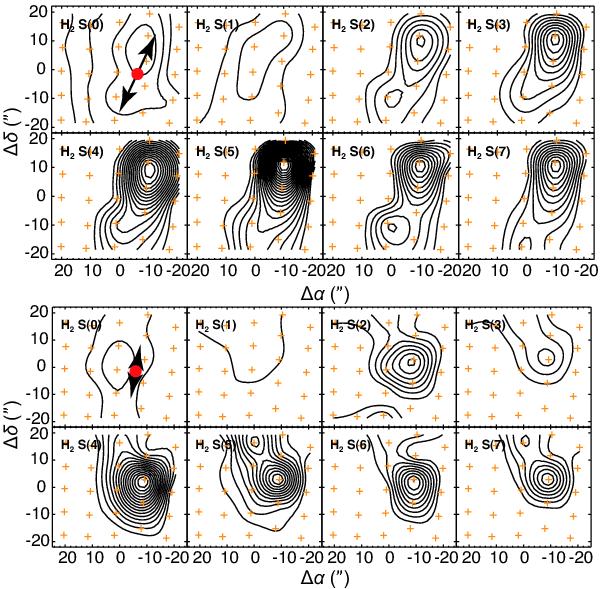
Spitzer spectral maps of the H2 rotational transitions around SMM3 (upper panels) and SMM4 (lower panels), which are resampled on the PACS footprint pattern. The 0–0 S(0) and S(1) transitions show diffuse emission. Higher energy transitions display the outflow pattern as in the case of CO and H2O, except for SMM4 where the extension to the north is only traced in [OI] (see Fig. 12). Contours start at 10-14 erg cm-2 s-1 and increase by 10-14 erg cm-2 s-1 steps.
Current usage metrics show cumulative count of Article Views (full-text article views including HTML views, PDF and ePub downloads, according to the available data) and Abstracts Views on Vision4Press platform.
Data correspond to usage on the plateform after 2015. The current usage metrics is available 48-96 hours after online publication and is updated daily on week days.
Initial download of the metrics may take a while.