Fig. 11
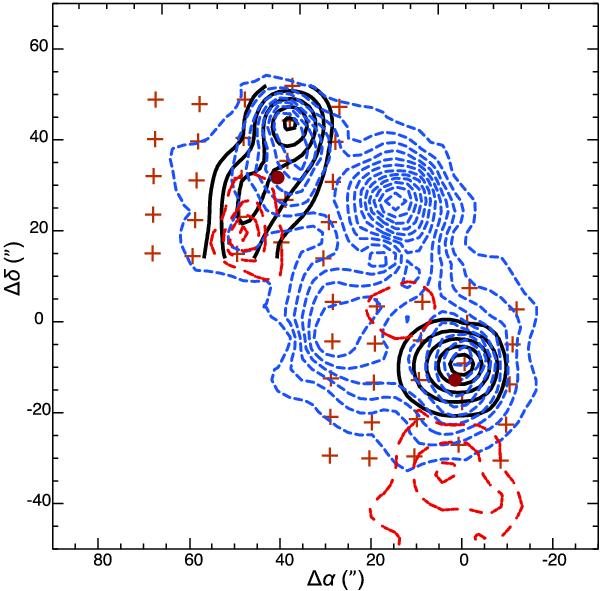
CO J = 18 − 17 emission observed with Herschel/PACS (black continuous contours) superimposed on high velocity CO J = 3 − 2 blue-shifted (blue, short-dashed contours) and red-shifted (red, long-dashed contours) emission from JCMT/HARP-B (Dionatos et al. 2010b). Positions of the PACS spaxels are indicated with (orange) crosses and the locations of SMM3 and SMM4 with (red) filled circles. Peaks of low and high J CO emission are coincident.
Current usage metrics show cumulative count of Article Views (full-text article views including HTML views, PDF and ePub downloads, according to the available data) and Abstracts Views on Vision4Press platform.
Data correspond to usage on the plateform after 2015. The current usage metrics is available 48-96 hours after online publication and is updated daily on week days.
Initial download of the metrics may take a while.