Free Access
Fig. 3
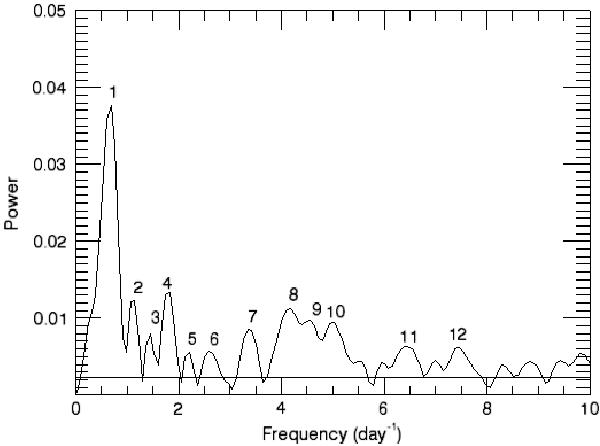
Power spectrum of the smoothed Light curve. The horizontal line at low power indicates the maximum power level of simulated random noise light curves. The numbers associated with the peaks in the power spectrum correspond to the frequencies and periods listed in Table 3.
Current usage metrics show cumulative count of Article Views (full-text article views including HTML views, PDF and ePub downloads, according to the available data) and Abstracts Views on Vision4Press platform.
Data correspond to usage on the plateform after 2015. The current usage metrics is available 48-96 hours after online publication and is updated daily on week days.
Initial download of the metrics may take a while.