Free Access
Fig. 10
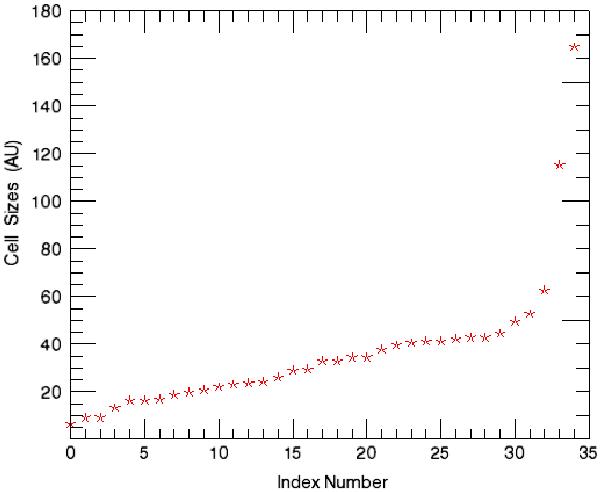
Distribution of the cell sizes in AU constructed using the data from the Table 4. The figure shows that the cell sizes form a continuum up to the size about 60 AU.
Current usage metrics show cumulative count of Article Views (full-text article views including HTML views, PDF and ePub downloads, according to the available data) and Abstracts Views on Vision4Press platform.
Data correspond to usage on the plateform after 2015. The current usage metrics is available 48-96 hours after online publication and is updated daily on week days.
Initial download of the metrics may take a while.