Fig. 2
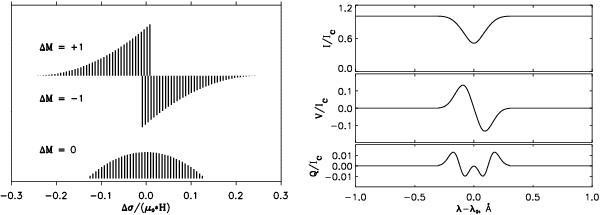
Zeeman pattern and the corresponding Stokes profiles for the transition in Eq. (14) in the Zeeman regime. a) Zeeman pattern composed of three groups of lines that belong to the transitions with ΔM = 0, ± 1. The horizontal axis is dimensionless; it depicts the energy deviation, scaled by the factor μ0H, of the magnetic transitions with respect to the transition in the absence of a magnetic field. The height of the lines indicates the strength of the particular magnetic transition. The group of lines in the middle that belongs to the transitions with ΔM = −1 is plotted downwards for the sake of clarity. b) Stokes profiles I/Ic, V/Ic, and Q/Ic. The horizontal axis depicts the deviation in angstroms from the line center, which is set to 0. The vertical axis shows a strength of the particular Stokes signal and is different for each of the three panels. Again, the profiles here were obtained from the energy deviations scaled by the factor μ0H.
Current usage metrics show cumulative count of Article Views (full-text article views including HTML views, PDF and ePub downloads, according to the available data) and Abstracts Views on Vision4Press platform.
Data correspond to usage on the plateform after 2015. The current usage metrics is available 48-96 hours after online publication and is updated daily on week days.
Initial download of the metrics may take a while.