| Issue |
A&A
Volume 557, September 2013
|
|
|---|---|---|
| Article Number | L18 | |
| Number of page(s) | 6 | |
| Section | Letters | |
| DOI | https://doi.org/10.1051/0004-6361/201322065 | |
| Published online | 23 September 2013 | |
The obscured hyper-energetic GRB 120624B hosted by a luminous compact galaxy at z = 2.20⋆,⋆⋆
1 Instituto de Astrofísica de Andalucía (IAA-CSIC), Glorieta de la Astronomía s/n, 18008 Granada, Spain
e-mail: This email address is being protected from spambots. You need JavaScript enabled to view it.
2 Dark Cosmology Centre, Niels Bohr Institute, Juliane Maries Vej 30, 2100 Copenhagen Ø, Denmark
3 INAF − Osservatorio Astronomico di Brera, via E. Bianchi 46, 23807 Merate, LC, Italy
4 Unidad Asociada Grupo Ciencia Planetarias UPV/EHU-IAA/CSIC, Departamento de Física Aplicada I, ETS Ingeniería, Universidad del País Vasco UPV/EHU, Alameda de Urquijo s/n, 48013 Bilbao, Spain
5 Ikerbasque, Basque Foundation for Science, Alameda de Urquijo 36-5, 48008 Bilbao, Spain
6 Department of Astronomy and Astrophysics, Department of Physics, and Center for Particle and Gravitational Astrophysics, Pennsylvania State University, 525 Davey Lab, University Park, PA 16802, USA
7 European Southern Observatory, Vitacura Casilla 19001, 19 Santiago de Chile, Chile
8 Harvard-Smithsonian Center for Astrophysics, Submillimeter Array, 645 North A’ohoku Place, Hilo, HI 96720, USA
9 Department of Physics, University of Warwick, Coventry, CV4 7AL, UK
Received: 12 June 2013
Accepted: 4 September 2013
Abstract
Context. Gamma-ray bursts (GRBs) are the most luminous explosions that we can witness in the Universe. Studying the most extreme cases of these phenomena allows us to constrain the limits for the progenitor models.
Aims. In this Letter, we study the prompt emission, afterglow, and host galaxy of GRB 120624B, one of the brightest GRBs detected by Fermi, to derive the energetics of the event and characterise the host galaxy in which it was produced.
Methods. Following the high-energy detection we conducted a multi-wavelength follow-up campaign, including near-infrared imaging from HAWKI/VLT, optical from OSIRIS/GTC, X-ray observations from the Chandra X-ray Observatory and at submillimetre/millimetre wavelengths from SMA. Optical/NIR spectroscopy was performed with X-shooter/VLT.
Results. We detect the X-ray and NIR afterglow of the burst and determine a redshift of z = 2.1974 ± 0.0002 through identification of emission lines of [O ii], [O iii] and H-α from the host galaxy of the GRB. This implies an energy release of Eiso,γ = (3.0 ± 0.2) × 1054 erg, amongst the most luminous ever detected. The observations of the afterglow indicate high obscuration with AV > 1.5. The host galaxy is compact, with R1/2 < 1.6 kpc, but luminous, at L ~ 1.5 L∗ and has a star formation rate of 91 ± 6 M⊙/yr as derived from Hα.
Conclusions. As for other highly obscured GRBs, GRB 120624B is hosted by a luminous galaxy, which we also prove to be compact, with very intense star formation. It is one of the most luminous host galaxies associated with a GRB, showing that the host galaxies of long GRBs are not always blue dwarf galaxies, as previously thought.
Key words: gamma-ray burst: individual: GRB 120624B
Based on observations collected at the European Southern Observatory, Chile, with programmes 089.D-0256 and 090.D-0667, at the Gran Telescopio Canarias with programmes GTC49-12A and GTC58-12B, at the Submillimeter Array with programme 2012A-S001, at CAHA with programme F13-3.5-031, at Liverpool Telescope with programme CL13A03, and a DDT programme at the Chandra X-ray Observatory.
Appendices are available in electronic form at http://www.aanda.org
© ESO, 2013
1. Introduction
Long gamma-ray bursts (GRBs) are extreme phenomena that release isotropic equivalent energies in the range of 1051−1054 erg in tens of seconds. This energy is thought to be emitted through collimated jets, which help to moderate the emitted energy down to ~1051 erg. If this range of energies is assumed, then GRBs can be explained by the collapse of very massive stars (Woosley 1993), although there are theories such as those where a highly magnetised and rapidly rotating neutron star could also produce GRBs (Usov 1992). There are a few cases where extreme energy releases of Eiso > 1054 ergs are produced. It has been suggested that some of these events have corrected energy releases that greatly exceed 1051 erg, which compromise some progenitor models (Cenko et al. 2011).
Extremely luminous events normally have very luminous counterparts. Even in these cases, some GRBs present very highly extinguished afterglows, owing to dust in the line of sight. This can result in strong observational biases in the samples that we are studying (Fynbo et al. 2009; Covino et al. 2013). Recent analysis of the hosts of obscured bursts have revealed that these events are produced in galaxies that are much more massive and luminous than previously thought (Krühler et al. 2011; Rossi et al. 2012; Perley et al. 2013).
GRB 120624B was one of the brightest GRBs detected by the Fermi satellite. In spite of this, initial searches failed to detect an optical counterpart because of strong intrinsic obscuration. In this Letter we present observations of its afterglow and luminous host galaxy, aiming to understand the energetics of the burst and the properties of the environment in which it was produced. Throughout this work we assume a cosmology with Ωm = 0.27, ΩΛ = 0.73, and H0 = 71 km s-1 Mpc-1.
2. Observations
2.1. Prompt γ-ray emission
GRB 120624B was detected by the Gamma-Ray Burst Monitor (GBM, Meegan et al. 2009) onboard the Fermi satellite at 22:23:54.92 UT on 24 June 2012 (t0 hereafter; Gruber et al. 2012). It was an extremely bright γ-ray event with a fluence of (1.916 ± 0.002) × 10-4 erg cm-2 (10 keV–10 MeV; Gruber 2012), which was also detected by INTEGRAL/SPI-ACS (Gruber et al. 2012), Konus/WIND (Golenetskii et al. 2012), Swift/BAT (Sakamoto et al. 2012b), and Suzaku/WAM (Sakamoto et al. 2012a). This fluence places it amongst the top 0.6% of bursts detected by Fermi/GBM and the 1.5% of the bursts detected by Swift/BAT (de Pasquale et al. 2012). The emission of the burst extended up to very high energies, with a significant detection over 100 MeV by the Fermi/LAT detector (Vianello & Kocevski 2012). The T90 duration of the burst is ~271 s, placing it at the high end of the GRB duration distribution.
Analysis of the GBM data1 shows three bright pulses, the first one starting 270 s before t0 and the last one ending 29 s after t0. We analysed the spectrum integrated over the total duration (~T90) of the burst by extracting the spectrum of the three main peaks. The background spectrum was obtained by selecting two time intervals before and after the burst. The sequence spectra in these two selected intervals were fitted with a third-order polynomial to account for the possible time variation of the background spectrum. Both time-integrated and time-resolved spectra were fitted with the typical Band function (Band et al. 1993). The best fit parameters of the average spectrum and of the three spectra corresponding to the main peaks are reported in Table A.1. In the non-standard analysis of the LAT data (LAT low energy events, LLE, roughly from 10 to 200 MeV), we also find the three peaks. To describe the high-energy spectrum, the GBM and LAT measurements were combined. This shows that the spectrum in the LAT energy range is still described well by a Band function, and no emerging high-energy extra component is evident. After the repointing, there was significant emission detected by standard analysis as well. We found the source with decreased flux density at 100 MeV compared to the emission seen in LLE data. While the number of photons is low, the temporal evolution of the high-energy portion appears broadly consistent with a power-law decay.
2.2. Afterglow observations
The first optical observations that were reported, starting 22 h after the burst were affected by the nearby Moon, and did not reach very constraining limits (Sanchez-Caso & Castro-Tirado 2012; Xu et al. 2012). The deepest optical limits were obtained with the GROND multiband imager (Greiner et al. 2008) at the 2.2 m telescope at La Silla Observatory, one day after the burst, with r′ < 24.0 (Schady et al. 2012), showing that the afterglow was already very faint and/or significantly extinguished.
Our observations began 24.7 h after the burst using the near-infrared (NIR) imager HAWKI at the Very Large Telescope (VLT) at Paranal Observatory. We performed observations using the KS-band, which were repeated the day after to check for variability, and again on day 19. Optical observations were done with OSIRIS at the GTC telescope 4.8 d after the burst in the r band. The results of the photometry of these observations are shown in Table B.1.
The Swift/XRT observations 2.5 d after the burst led to identifying of two faint sources within the BAT error circle (S1 and S2; Sakamoto et al. 2012b). Subsequent visits at 3.3 and 8.2 d detected only S2 but failed to impose strong-enough limits to confirm the decay of S2.
Chandra observed the field of GRB 120624B starting on June 30, 2012 at 23:58 UT, 6.1 d after the burst trigger. The field was imaged with the S3 CCD for 10 ks. A comparison with a Swift/XRT image led to identifying the afterglow (Campana et al. 2012): S1 dimmed considerably, and instead source S2 was at a comparable level. The position determined with wavdetect is RA(J2000): 11h23m32 32 and Dec(J2000): +8 55′
 . The uncertainty is dominated by the Chandra boresight and is
  . The number of photons collected with Swift/XRT and Chandra is very low. For this reason we used C-statistics within XSPEC. We fit the data assuming the same spectral model and left only the normalisation free. We used an absorbed power law with a Galactic absorption component (fixed to 4.1 × 1020 cm-2) and a free component at the host redshift. The best fit photon index is
  (obtained with ΔC = 2.71), and the intrinsic column density is
 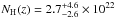 cm-2 at the redshift of the GRB (see below).
In view of the extreme brightness of the GRB event, we performed two observations in mm/submm wavelengths using the SubMillimeter Array (SMA). The first observation was carried out on 26 June between UT 4:30 and 8:30. Observations were aimed at the early Swift/BAT position, which was 18′′ away from the nominal GRB position, right on the edge of the 36′′ primary beam of the SMA antennas at the 358 GHz observed frequency. The achieved 1σ rms of 3.8 mJy yielded an rms of 11 mJy at the GRB position. The second observation, was carried out on 29 June between UT 4:45 and 8:10, towards the position RA(J2000): 11h23m318 and Dec(J2000): +855′47, which showed tentative emission in the first observation. This position turned out to be only 8′′ away from the GRB position and well within the 55′′ primary beam of the SMA at the 230 GHz frequency of this second observation. The observation resulted in a 1σ rms of 0.7 mJy. The limits obtained in our data are consistent with the 1 mJy detection obtained at the Plateau de Bure Observatory in the 86 GHz band (Bremer et al. 2012).
2.3. Host galaxy observations
Late imaging was performed several months after the GRB using OSIRIS at the 10.4 m GTC and the 2.0 m Liverpool Telescope for the optical, HAWKI at the 8.2 m VLT for the NIR and Omega2000 at the 3.5 m CAHA in Y-band to study the host galaxy of the event, and characterise its spectral energy distribution (SED). The host is detected in the g, r, i, z, J, H, and KS filters as a point-like source, even in the highest resolution NIR data, where the seeing was ~0.4′′. The detections in the NIR have low signal-to-noise ratio (S/N), so an extended, lower surface brightness component could not be discounted, although no extended emission is seen in the optical data either, where the S/N is higher, with a seeing of ~1.1′′.
Between 17.1 and 19.1 days after the burst, we performed three spectroscopic observations using the X-shooter spectrograph (Vernet et al. 2011) at the 8.2 m UT 2 of the VLT covering the complete wavelength range from 3000 to 24 800 Å at intermediate resolution. The total observation time consisted of 5 × 1200 s in the UltraViolet/Blue and the Visible arms and 21 × 300 s in the NIR arm, with 1.0′′, 0.9′′, and 0.9′′ slits, respectively. All the three epochs were combined to produce the best possible spectrum, given that the observations had to be performed at high airmass and that the target was faint. The resulting spectrum has a seeing of 0.9′′. In the combined data we detect emission lines of [O ii], [O iii], and H -α at a common redshift of z = 2.1974 ± 0.0002, which we identify as the redshift of the host galaxy and, consequently, of the GRB (see Fig. 1).
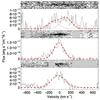 |
Fig. 1 Sections of the X-shooter spectrum showing the emission lines of [O ii] (top, centred between the two lines of the doublet), [O iii] (middle), and H -α (bottom). Regions affected by sky lines and detector defects have been masked. |
3. Results and discussion
3.1. Afterglow
Although image subtraction of the first two NIR epochs did not show any significant variability at the location of the GRB (D’Avanzo et al. 2012; de Ugarte Postigo et al. 2012a), the comparison with the later epochs reveals the presence of a counterpart. Image subtraction was performed using the ISIS package (Alard & Lupton 1998; Alard 2000) with the KS-band frames obtained with HAWKI. The difference in flux observed for our target between the first epoch and the last (which only has flux from the host galaxy) enabled us to estimate the pure afterglow contribution. In the first epoch, 1 d after the burst, the afterglow magnitude was 21.10 ± 0.33 and 2 d after the burst 21.40 ± 0.40, whereas 19 days after the burst, the afterglow is no longer detected. The location of the afterglow has an offset with respect to the centroid of the host galaxy of 0.11 ± 0.04′′, equivalent to 0.94 ± 0.34 kpc at the redshift of the GRB. This is also consistent with the median offset of ~1.2 kpc measured between long GRB afterglows and their host galaxies (Bloom et al. 2002; de Ugarte Postigo et al. 2012b). Our best equatorial coordinates of the afterglow, as compared to the SDSS DR8 catalogue, are (J2000 ± 0.3′′, including statistical and catalogue errors) RA: 11h23m3230 and Dec: +8 55′ .
.
Considering our KS-band and X-ray detections of the afterglow, we can estimate the minimum extinction needed to explain the detection limits provided by GROND (Schady et al. 2012). By assuming the least constraining case, where there is no spectral break between NIR and X-rays, we get a maximum slope value to which we can add the Galactic extinction. We correct the detection limits of GROND by subtracting the contribution of the host galaxy, for which we have late-time photometry. Under these conditions we find that we need an extinction of at least AV > 1.5 mag to be consistent with the detection limits (see Fig. C.1), assuming a Small Magellanic Cloud extinction law (the value is slightly higher if we consider a Milky Way extinction law). This confirms that GRB 120624B is a strongly extinguished burst. In this exercise we have combined data from slightly different epochs: HAWKI data correspond to day 2, GROND observations to day 1, and X-ray data to 2.7 days after the burst. Our HAWKI observations show that there is not much difference between days 1 and 2 in the NIR afterglow (the decay is 0.30 ± 0.52 mag), extrapolating the GROND data to day 2 would just make the limits tighter. In a similar way, XRT is probably a bit lower than what would correspond, which would flatten the slope and again require stronger extinction. In conclusion, the AV > 1.5 mag is a conservative limit on the extinction of this burst.
With a peak emission of ~1 mJy (Bremer et al. 2012), the millimetre emission of GRB 120624B is close to the typical luminosity in the sample of GRB afterglow detections (~1032 erg s-1 Hz-1de Ugarte Postigo et al. 2012c) and far from the extremely bright GRB afterglows, peaking at ~1033 erg s-1 Hz-1.
3.2. Host galaxy
We use LePhare (v. 2.2, Arnouts et al. 1999; Ilbert et al. 2006) to fit the optical-to-NIR SED of the host to a set of galaxy templates based on the models from Bruzual & Charlot (2003) created following the same procedure as in Krühler et al. (2011). The SED shape is reproduced best (χ2/dof = 2.8/7) by a galaxy template (see Fig. 2) with an extinction of E(B − V) = 0.25 (Calzetti extinction law, implying AV,host = 1.0 Calzetti et al. 2000), an age of  yr, a mass of log(M∗/M⊙)
  , and a star formation rate of log(SFR)
 yr-1 (log(SSFR)
  yr-1).
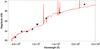 |
Fig. 2 Optical to NIR flux density distribution of the host galaxy. Dots indicate the detections in grizJHKS, whereas the triangle is a 3σ detection limit in Y. In red is the best fit to a galaxy template. |
The host galaxy has an absolute magnitude of Mr = −22.2 mag and Mg = −21.6 (Mr = −23.1 and Mg = −22.6 extinction corrected). Taking the UV luminosity function at z ~ 2 (e.g. Reddy et al. 2008), which corresponds to wavelengths between g and r in our observer frame, the galaxy has a luminosity of 1.5 L* if assuming M1700 Å = −22.0 mag, making it one of the most luminous GRB hosts detected to date (Krühler et al. 2011). Our images show a very compact object consistent with being point-like, which at a seeing of 0 4 in the best images implies R1/2 < 1.6 kpc. However, the emission lines are extended in the wavelength direction with a FWHM ~ 200 km s-1 following a smooth Gaussian profile and no extension in the spatial direction.
From the Hα emission line (see appendix) we derive a SFR of 42 ± 3 M⊙/yr (91 ± 6 M⊙/yr when corrected for extinction). The errors do not include the uncertainties of the method (~30% Kennicutt 1998) or the ones from the flux calibration (~20%). We can also make a rough estimate of the metallicity using the R23 parameter (Kobulnicky et al. 1999) by extrapolating the Hβ flux from the extinction-corrected Hα flux assuming case B recombination that demands a ratio of Hα/Hβ = 2.86. This yields log R23 = 0.84, which implies a metallicity of around 12+log(O/H) = 8.4 or half solar. (At this metallicity, the two-valued R23 metallicity function has an unambiguous solution.)
While most GRB hosts are low-mass blue galaxies (e.g. Savaglio et al. 2009), recently a few massive hosts with luminosities and masses similar to that of the GRB 120624B host have been found (Rossi et al. 2012; Krühler et al. 2011; Perley et al. 2013). In fact, dark GRBs are more often found in massive galaxies, some of which are EROs (Rossi et al. 2012), and often the extinction in the host galaxy correlates with the extinction of the afterglow, implying a rather uniform dust distribution in the host (Perley et al. 2013). Most of those massive dusty GRB hosts also have supersolar metallicities (e.g. GRB 020819, Levesque et al. 2010; GRB 080605, Krühler et al. 2012; GRB 070802, Elíasdóttir et al. 2009), naturally following the mass-metallicity relation. The host of GRB 120624B, however, has a somewhat lower metallicity as expected for its mass at z ~ 2 (Erb et al. 2006) which could be related to the high star formation since SF galaxies usually have lower metallicities (Mannucci et al. 2010). The afterglow has a somewhat higher extinction than the host, but still within the equal distribution for GRB hosts as shown in Perley et al. (2013), Fig. 15, although we have to consider that the extinction of the afterglow is a lower limit. GRB 120624B might therefore be in an intrinsically more extinguished region like a molecular cloud that has not yet dissolved or simply behind a more obscured sightline in the host.
The host of GRB 120624B could be similar to luminous compact galaxies (LCGs) detected at somewhat lower redshifts and proposed to be the progenitors of today’s spiral galaxy bulges (e.g. Hammer et al. 2001). LCGs have luminosities up to 1.4 L* and masses up to 1011 M⊙, half light radii of R1/2 < 4.5 kpc, high SFRs (average 40 M⊙/yr), relatively high extinctions (AV ~ 1.5 mag), and a range of metallicities, which are all similar to our GRB host. Some LCGs show indications of a low surface brightness region surrounding the compact core, and they all have strong metal absorption lines, both of which would be unobservable in our case. Our host galaxy might thus be similar to a LCG, which is in a crucial state of its evolution, experiencing an episode of heavy SF before developing in a spiral or an elliptical galaxy.
4. Conclusions
We have unambiguously identified the NIR and X-ray counterpart of GRB 120624B. Combining our afterglow detections with the available limits from the literature, we estimated an extinction greater than AV > 1.5 magnitudes. Spectroscopy of the host galaxy reveals strong emission lines at a redshift of z = 2.1975 ± 0.0002 and FWHM of 200 km s-1. At this redshift, GRB 120624B was an extremely luminous event, with an Eiso,γ = (3.0 ± 0.2) × 1054 erg. The host galaxy can be classified as an LCG, with an R1/2 < 1.6 kpc and a luminosity corresponding to ~1.5L*. It is one of the GRB hosts with higher SFR, with 91 ± 6 M⊙/yr as derived from Hα.
Online material
Appendix A: Prompt emission
Table A.1 displays the results of the spectral fitting of the Fermi/GBM data.
GBM energy analysis of the 3 main γ-ray peaks and of the complete burst.
Appendix B: Observations
Table B.1 presents the observing log of our optical, NIR, and mm/submm observations.
Observing log.
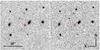 |
Fig. B.1 KS-band images of the field of GRB 120624B obtained 1 day after the burst (left), where the afterglow is still visible, and 6 months later (right) when only the host galaxy remains. The seeing in both frames is ~0.4′′. |
Appendix C: Spectral energy distribution and intrinsic extinction
Figure C.1 shows the fit of the NIR to X-ray SED with an extinguished power law. From this fit we derive a minimum intrinsic extinction in the line of sight of the GRB of AV = 1.5 mag, as described in Sect. 3.1.
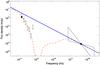 |
Fig. C.1 Near-infrared to X-ray SED at ~2 days, showing an estimation of the minimum extinction necessary to explain the detection limits. Filled circles indicate NIR and X-ray afterglow detections, whereas empty circles with arrows mark detection limits. The thick line is the minimum slope needed between NIR and X-rays to explain the detections, and the dashed line is the same slope after adding the Galactic extinction and an intrinsic extinction of AV = 1.5 mag. |
Appendix D: Spectral line fluxes
Table D.1 presents the results of fitting Gaussians to the host galaxy emission lines. In the case of the [O ii] λλ3727, 3729 doublet and owing to the low S/N of the feature, the width of the Gaussian was fixed to σ = 100 km s-1 in order to constrain the number of free parameters in the fit. In all cases the spectral extractions were done with apertures of 1.4′′, which is well above the 0.9′′ seeing to minimise the loss of light. The flux errors do not include any systematic error in the absolute flux calibration, which can be estimated at ~20%.
Fits to the emission lines of the host galaxy.
Acknowledgments
We thank the anonymous referee for the careful and constructive revision of our manuscript. We thank Thomas Krühler for his help with the SED fitting and Lise Christensen for fruitful discussions. Based on observations made with the Gran Telescopio Canarias (GTC) at the Roque de los Muchachos Observatory (La Palma). The research activity of A.d.U.P., C.T., and J.G. is supported by Spanish research project AYA2012-39362-C02-02. AdUP acknowledges support by the European Commission under the Marie Curie Career Integration Grant programme (FP7-PEOPLE-2012-CIG 322307). J.G. is supported by the Unidad Asociada IAA-CSIC_ETSI-UPV/EHU and the Ikerbasque Foundation for Science. P.V. acknowledges NASA NNX13AH50G and OTKA K077795. The Dark Cosmology Centre is funded by the DNRF. S.C. acknowledges support by ASI grant I/011/07/0 and PRIN-MIUR grant 2009ERC3HT. We thank H. Tananbaum for granting the Chandra DDT.
References
- Alard, C. 2000, A&AS, 144, 363 [NASA ADS] [CrossRef] [EDP Sciences] [Google Scholar]
- Alard, C., & Lupton, R. H. 1998, ApJ, 503, 325 [NASA ADS] [CrossRef] [Google Scholar]
- Arnouts, S., Cristiani, S., Moscardini, L., et al. 1999, MNRAS, 310, 540 [NASA ADS] [CrossRef] [Google Scholar]
- Band, D., Matteson, J., Ford, L., et al. 1993, ApJ, 413, 281 [NASA ADS] [CrossRef] [Google Scholar]
- Bloom, J. S., Kulkarni, S. R., & Djorgovski, S. G. 2002, AJ, 123, 1111 [NASA ADS] [CrossRef] [Google Scholar]
- Bremer, M., Winters, J. M., Konig, S., de Ugarte Postigo, A., & Castro-Tirado, A. J. 2012, GRB Coordinates Network, 13421, 1 [Google Scholar]
- Bruzual, G., & Charlot, S. 2003, MNRAS, 344, 1000 [NASA ADS] [CrossRef] [Google Scholar]
- Calzetti, D., Armus, L., Bohlin, R. C., et al. 2000, ApJ, 533, 682 [NASA ADS] [CrossRef] [Google Scholar]
- Campana, S., de Ugarte Postigo, A., & Levan, A. J. 2012, GRB Coordinates Network, 13400, 1 [Google Scholar]
- Cenko, S. B., Frail, D. A., Harrison, F. A., et al. 2011, ApJ, 732, 29 [NASA ADS] [CrossRef] [Google Scholar]
- Covino, S., Melandri, A., Salvaterra, R., et al. 2013, MNRAS, 432, 1231 [NASA ADS] [CrossRef] [Google Scholar]
- D’Avanzo, P., de Ugarte Postigo, A., Campana, S., et al. 2012, GRB Coordinates Network, 13391, 1 [Google Scholar]
- de Pasquale, M., Gruber, D., Burgess, J. M., et al. 2012, GRB Coordinates Network, 13389, 1 [Google Scholar]
- de Ugarte Postigo, A., D’Avanzo, P., Campana, S., et al. 2012a, GRB Coordinates Network, 13395, 1 [Google Scholar]
- de Ugarte Postigo, A., Fynbo, J. P. U., Thöne, C. C., et al. 2012b, A&A, 548, A11 [NASA ADS] [CrossRef] [EDP Sciences] [Google Scholar]
- de Ugarte Postigo, A., Lundgren, A., Martín, S., et al. 2012c, A&A, 538, A44 [NASA ADS] [CrossRef] [EDP Sciences] [Google Scholar]
- Elíasdóttir, Á., Fynbo, J. P. U., Hjorth, J., et al. 2009, ApJ, 697, 1725 [NASA ADS] [CrossRef] [Google Scholar]
- Erb, D. K., Shapley, A. E., Pettini, M., et al. 2006, ApJ, 644, 813 [NASA ADS] [CrossRef] [Google Scholar]
- Fynbo, J. P. U., Jakobsson, P., Prochaska, J. X., et al. 2009, ApJS, 185, 526 [NASA ADS] [CrossRef] [Google Scholar]
- Golenetskii, S., Aptekar, R., Frederiks, D., et al. 2012, GRB Coordinates Network, 13382, 1 [Google Scholar]
- Greiner, J., Bornemann, W., Clemens, C., et al. 2008, PASP, 120, 405 [NASA ADS] [CrossRef] [Google Scholar]
- Gruber, D. 2012, GRB Coordinates Network, 13383, 1 [Google Scholar]
- Gruber, D., Burgess, J. M., & Connaughton, V. 2012, GRB Coordinates Network, 13377, 1 [Google Scholar]
- Hammer, F., Gruel, N., Thuan, T. X., Flores, H., & Infante, L. 2001, ApJ, 550, 570 [NASA ADS] [CrossRef] [Google Scholar]
- Ilbert, O., Arnouts, S., McCracken, H. J., et al. 2006, A&A, 457, 841 [NASA ADS] [CrossRef] [EDP Sciences] [Google Scholar]
- Kennicutt, Jr., R. C. 1998, ARA&A, 36, 189 [Google Scholar]
- Kobulnicky, H. A., Kennicutt, Jr., R. C., & Pizagno, J. L. 1999, ApJ, 514, 544 [NASA ADS] [CrossRef] [Google Scholar]
- Krühler, T., Greiner, J., Schady, P., et al. 2011, A&A, 534, A108 [NASA ADS] [CrossRef] [EDP Sciences] [Google Scholar]
- Krühler, T., Fynbo, J. P. U., Geier, S., et al. 2012, A&A, 546, A8 [NASA ADS] [CrossRef] [EDP Sciences] [Google Scholar]
- Levesque, E. M., Kewley, L. J., Graham, J. F., & Fruchter, A. S. 2010, ApJ, 712, L26 [NASA ADS] [CrossRef] [Google Scholar]
- Mannucci, F., Cresci, G., Maiolino, R., Marconi, A., & Gnerucci, A. 2010, MNRAS, 408, 2115 [NASA ADS] [CrossRef] [Google Scholar]
- Meegan, C., Lichti, G., Bhat, P. N., et al. 2009, ApJ, 702, 791 [NASA ADS] [CrossRef] [Google Scholar]
- Perley, D. A., Levan, A. J., Tanvir, N. R., et al. 2013, ApJ, submitted [arXiv:1301.5903] [Google Scholar]
- Reddy, N. A., Steidel, C. C., Pettini, M., et al. 2008, ApJS, 175, 48 [NASA ADS] [CrossRef] [Google Scholar]
- Rossi, A., Klose, S., Ferrero, P., et al. 2012, A&A, 545, A77 [Google Scholar]
- Sakamoto, A., Tashiro, M., Terada, Y., et al. 2012a, GRB Coordinates Network, 13413, 1 [Google Scholar]
- Sakamoto, T., Barthelmy, S. D., Baumgartner, W. H., et al. 2012b, GRB Coordinates Network, 13384, 1 [Google Scholar]
- Sanchez-Caso, A., & Castro-Tirado, A. J. 2012, GRB Coordinates Network, 13385, 1 [Google Scholar]
- Savaglio, S., Glazebrook, K., & Le Borgne, D. 2009, ApJ, 691, 182 [NASA ADS] [CrossRef] [MathSciNet] [Google Scholar]
- Schady, P., Nicuesa Guelbenzu, A., Klose, S., et al. 2012, GRB Coordinates Network, 13393, 1 [Google Scholar]
- Schlafly, E. F., & Finkbeiner, D. P. 2011, ApJ, 737, 103 [NASA ADS] [CrossRef] [Google Scholar]
- Usov, V. V. 1992, Nature, 357, 472 [NASA ADS] [CrossRef] [Google Scholar]
- Vernet, J., Dekker, H., D’Odorico, S., et al. 2011, A&A, 536, A105 [NASA ADS] [CrossRef] [EDP Sciences] [Google Scholar]
- Vianello, G., & Kocevski, D. 2012, GRB Coordinates Network, 13379, 1 [Google Scholar]
- Woosley, S. E. 1993, ApJ, 405, 273 [NASA ADS] [CrossRef] [Google Scholar]
- Xu, D., de Ugarte Postigo, A., Malesani, D., Gandolfi, D., & Leloudas, G. 2012, GRB Coordinates Network, 13387, 1 [CrossRef] [Google Scholar]
All Tables
All Figures
|
Fig. 1 Sections of the X-shooter spectrum showing the emission lines of [O ii] (top, centred between the two lines of the doublet), [O iii] (middle), and H -α (bottom). Regions affected by sky lines and detector defects have been masked. |
| In the text | |
|
Fig. 2 Optical to NIR flux density distribution of the host galaxy. Dots indicate the detections in grizJHKS, whereas the triangle is a 3σ detection limit in Y. In red is the best fit to a galaxy template. |
| In the text | |
|
Fig. B.1 KS-band images of the field of GRB 120624B obtained 1 day after the burst (left), where the afterglow is still visible, and 6 months later (right) when only the host galaxy remains. The seeing in both frames is ~0.4′′. |
| In the text | |
|
Fig. C.1 Near-infrared to X-ray SED at ~2 days, showing an estimation of the minimum extinction necessary to explain the detection limits. Filled circles indicate NIR and X-ray afterglow detections, whereas empty circles with arrows mark detection limits. The thick line is the minimum slope needed between NIR and X-rays to explain the detections, and the dashed line is the same slope after adding the Galactic extinction and an intrinsic extinction of AV = 1.5 mag. |
| In the text | |
Current usage metrics show cumulative count of Article Views (full-text article views including HTML views, PDF and ePub downloads, according to the available data) and Abstracts Views on Vision4Press platform.
Data correspond to usage on the plateform after 2015. The current usage metrics is available 48-96 hours after online publication and is updated daily on week days.
Initial download of the metrics may take a while.