Fig. 5
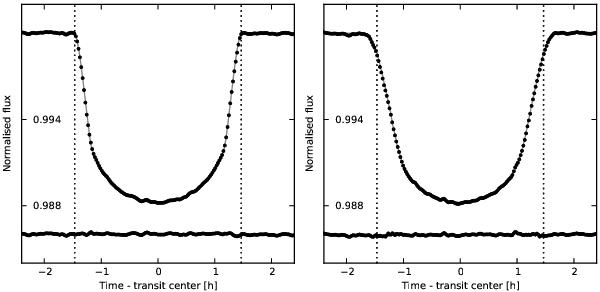
Phase-folded transit light curve of Kepler-77. Short- and long-cadence Kepler data are shown in the left and right panel, respectively, binned at ~1.7 min. The best-fitting model is overplotted with a solid grey line. The dashed vertical lines mark the planet’s true first and fourth contact. The apparent transit duration is longer for the LC data than for the SC data, owing to the low time resolution.
Current usage metrics show cumulative count of Article Views (full-text article views including HTML views, PDF and ePub downloads, according to the available data) and Abstracts Views on Vision4Press platform.
Data correspond to usage on the plateform after 2015. The current usage metrics is available 48-96 hours after online publication and is updated daily on week days.
Initial download of the metrics may take a while.