Fig. 3
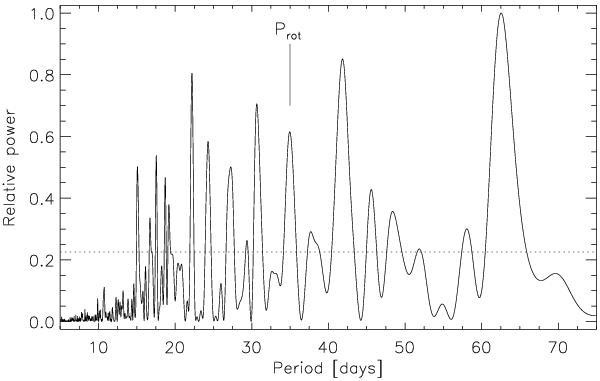
Lomb-Scargle periodogram of the Kepler LC lightcurve of Kepler-77, following subtraction of the best-fitting transit model. The horizontal dashed line denotes the 0.1% false-alarm probability. The vertical line marks the rotational period of Kepler-77, as derived from the autocorrelation function method (see text for details).
Current usage metrics show cumulative count of Article Views (full-text article views including HTML views, PDF and ePub downloads, according to the available data) and Abstracts Views on Vision4Press platform.
Data correspond to usage on the plateform after 2015. The current usage metrics is available 48-96 hours after online publication and is updated daily on week days.
Initial download of the metrics may take a while.