Fig. 1
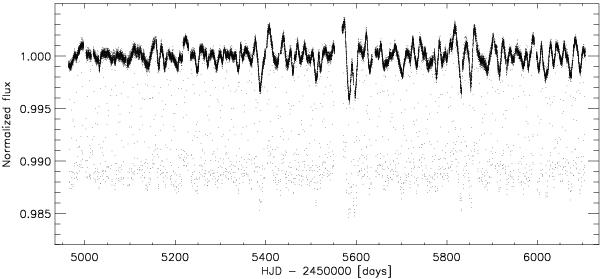
Q1 – Q13Kepler LC light curve of Kepler-77. The data from different quarters have been stitched together by arbitrarily normalising the flux by the out-of-transit median value per quarter. The points around normalised flux ~0.99 mark the bottom of the 298 transits observed in LC mode. The light curve shows an out-of-transit flux variations with a peak-to-peak amplitude of ~0.4%.
Current usage metrics show cumulative count of Article Views (full-text article views including HTML views, PDF and ePub downloads, according to the available data) and Abstracts Views on Vision4Press platform.
Data correspond to usage on the plateform after 2015. The current usage metrics is available 48-96 hours after online publication and is updated daily on week days.
Initial download of the metrics may take a while.