Fig. 5
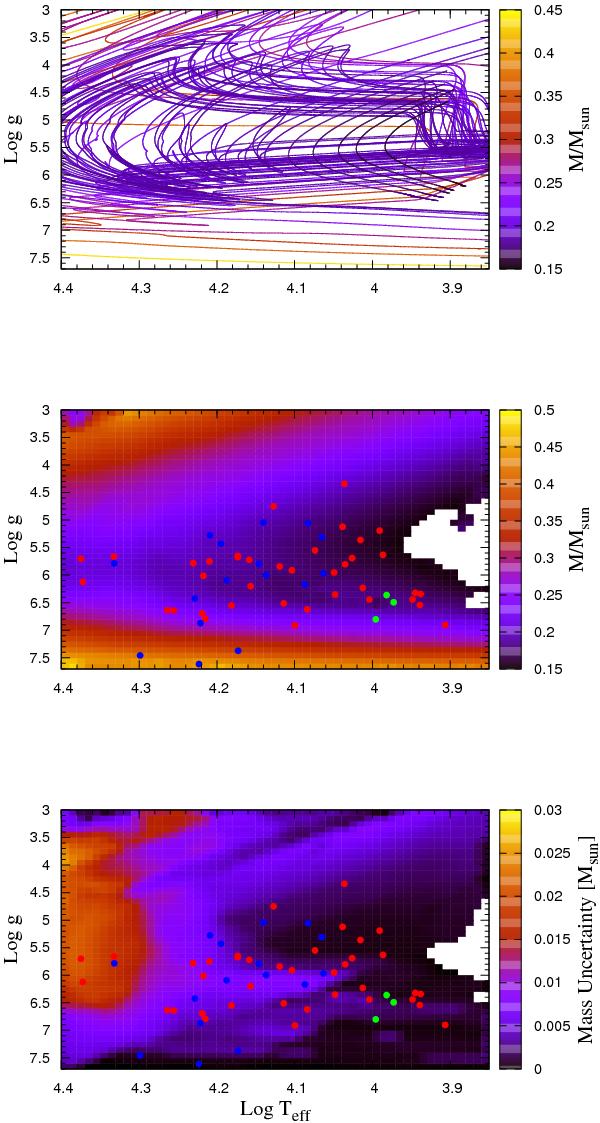
Top panel: M(log Teff,log g) relation as obtained directly from stellar evolution simulations. Middle panel: M(log Teff,log g) relation derived from the weighted least square scheme described in Sect. 4. Bottom panel: uncertainty σM of the derived M(log Teff,log g) relation. Symbols correspond to the observed post-RGB low-mass stars listed in Table 2. In particular, green circles correspond to the pulsating ELM white dwarfs detected by Hermes et al. (2013). White regions in the middle and bottom panels indicate either fast evolutionary stages for which not enough points were available to obtain an accurate fit (in the case of CNO-flashing sequences) or simply that no tracks are available at that region.
Current usage metrics show cumulative count of Article Views (full-text article views including HTML views, PDF and ePub downloads, according to the available data) and Abstracts Views on Vision4Press platform.
Data correspond to usage on the plateform after 2015. The current usage metrics is available 48-96 hours after online publication and is updated daily on week days.
Initial download of the metrics may take a while.