Fig. 5
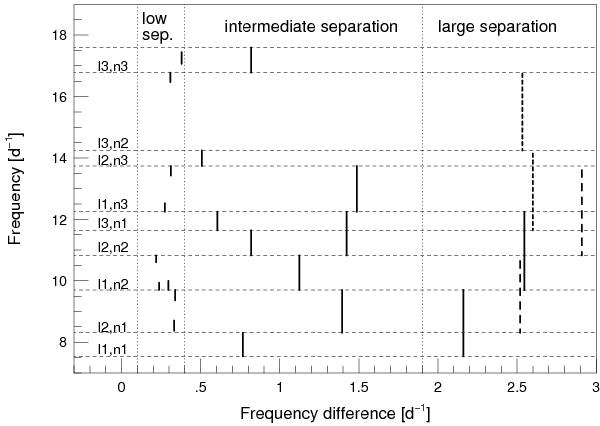
Patterns recognized among the highest amplitude modes are presented. The horizontal dashed lines give the frequencies marked by boldface in Table 2. The frequency differences corresponding to the dominant spacings in Fig. 4 are marked by vertical lines between the given frequencies at the actual values. Groups of spacing are divided by vertical dotted lines and labelled as low, intermediate, and large separations. Different sequences in the large separation are plotted by continuous, large dashed, and small dashed lines. The members of sequences are labelled by different ℓ values and consecutive radial orders (n) in the left part.
Current usage metrics show cumulative count of Article Views (full-text article views including HTML views, PDF and ePub downloads, according to the available data) and Abstracts Views on Vision4Press platform.
Data correspond to usage on the plateform after 2015. The current usage metrics is available 48-96 hours after online publication and is updated daily on week days.
Initial download of the metrics may take a while.