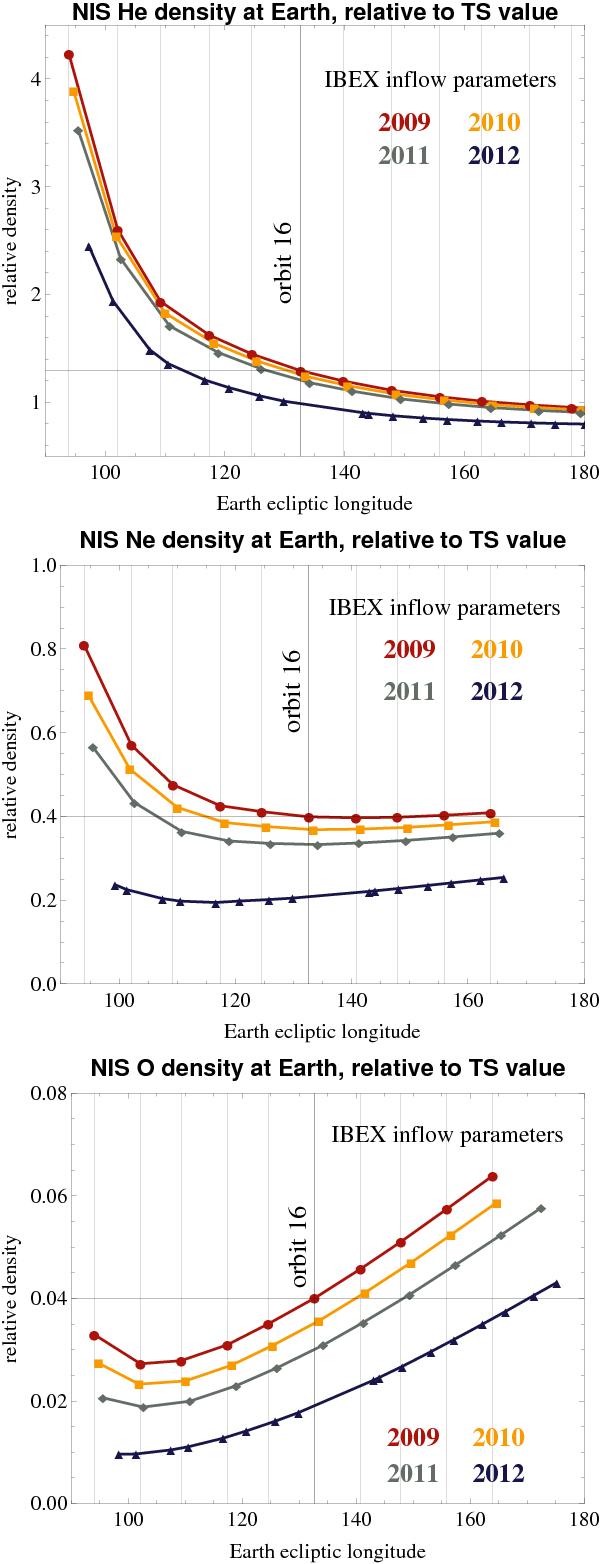
Fig. 9

Relative densities (scaled to the values at TS, Eq. (32)) for NIS He, Ne, and O for the four IBEX sampling seasons, calculated for the apogee times of IBEX orbits for the inflow parameters obtained by Bzowski et al. (2012) from IBEX NIS He observations. The vertical bars mark the longitudes of IBEX apogees in 2009, the horizontal bars marks the relative density levels for this time and location in space.
Current usage metrics show cumulative count of Article Views (full-text article views including HTML views, PDF and ePub downloads, according to the available data) and Abstracts Views on Vision4Press platform.
Data correspond to usage on the plateform after 2015. The current usage metrics is available 48-96 hours after online publication and is updated daily on week days.
Initial download of the metrics may take a while.


