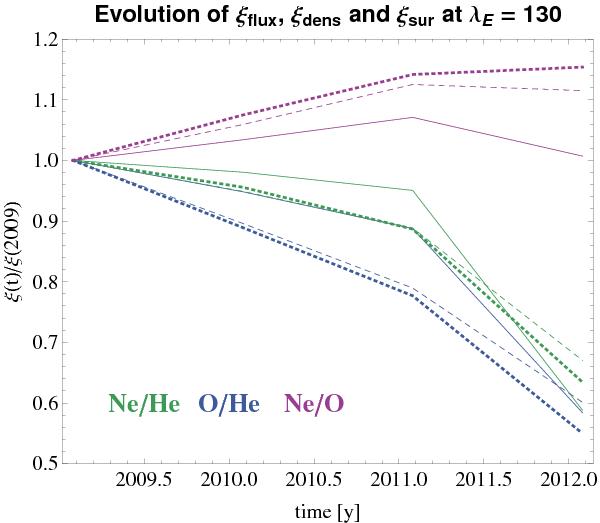
Fig. 15

Relative change of the ξ quotients for the season-integrated flux (solid lines), densities at the ecliptic longitude where the NIS gas flow intersects the Earth’s orbit (broken lines), and time-dependent survival probabilities of the NIS atoms reaching IBEX at this location (dotted lines). All quantities are shown as ratios to the respective values in 2009. The color code for species pairs is indicated in the panel.
Current usage metrics show cumulative count of Article Views (full-text article views including HTML views, PDF and ePub downloads, according to the available data) and Abstracts Views on Vision4Press platform.
Data correspond to usage on the plateform after 2015. The current usage metrics is available 48-96 hours after online publication and is updated daily on week days.
Initial download of the metrics may take a while.


