Free Access
Fig. B.3
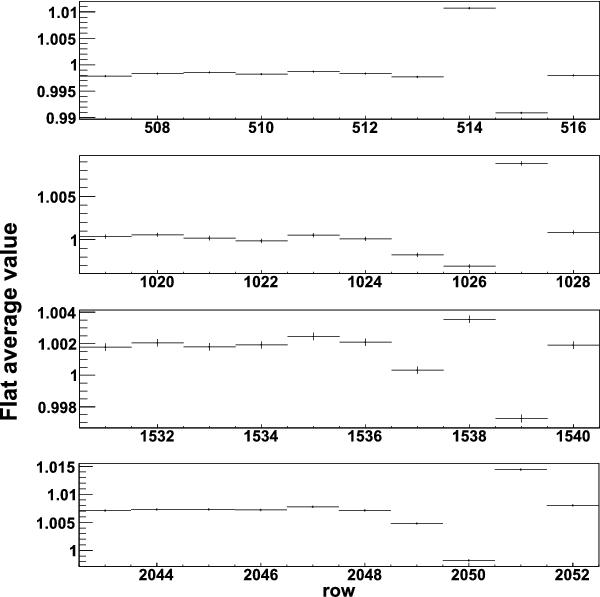
Flat-field average value along rows as a function of y, zoomed around some of the discontinuities of Fig. B.1. The response variation extends over a few rows and is typically on the order of 1%. They are located at y ≃ 3 + n × 512.
Current usage metrics show cumulative count of Article Views (full-text article views including HTML views, PDF and ePub downloads, according to the available data) and Abstracts Views on Vision4Press platform.
Data correspond to usage on the plateform after 2015. The current usage metrics is available 48-96 hours after online publication and is updated daily on week days.
Initial download of the metrics may take a while.