Fig. B.1
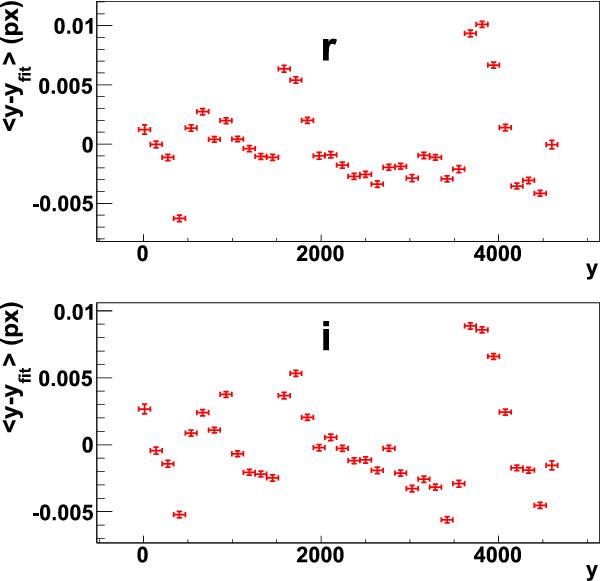
Average astrometric residuals along y (expressed in pixels) as a function of the y coordinate of measurements, for measurements in CCD 12 of stars brighter than 20.5. The average runs over the 4 SNLS science fields, i.e. ~2000 r images and ~3000 i images. The shape is very similar in r- and i-bands, suggesting some instrumental source. The jumps of residuals happen at y values close to multiples of 512.
Current usage metrics show cumulative count of Article Views (full-text article views including HTML views, PDF and ePub downloads, according to the available data) and Abstracts Views on Vision4Press platform.
Data correspond to usage on the plateform after 2015. The current usage metrics is available 48-96 hours after online publication and is updated daily on week days.
Initial download of the metrics may take a while.