Fig. 2
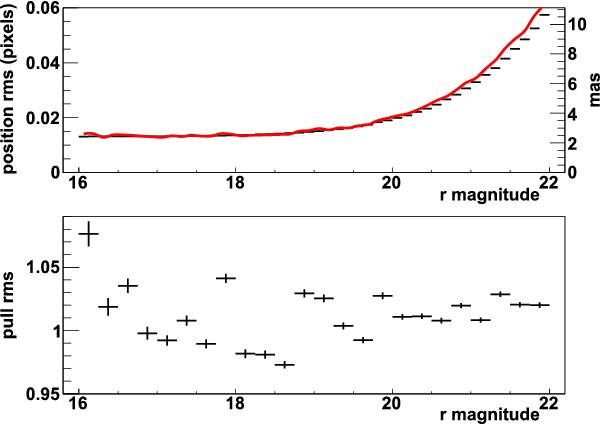
Astrometric 1D residuals scatter as a function of star magnitude for the D3 field in r band. The top plot compares, as a function of magnitude, the measured residual rms (points) with the average expected rms (curve) including a noise floor of 0.013 pixels. They are roughly compatible, but not necessarily equal because the expected rms varies with IQ at fixed magnitude. The bottom plot displays the rms of the residual pulls (i.e. residuals in unit of expected rms), which are close to 1 at all magnitudes. We hence conclude that adding the position noise floor of 0.013 pixels (2.4 mas) in quadrature to the position uncertainty expected from shot noise fairly describes the residuals. This figure only considers residuals along y for reasons explained in Sect. 6.2.
Current usage metrics show cumulative count of Article Views (full-text article views including HTML views, PDF and ePub downloads, according to the available data) and Abstracts Views on Vision4Press platform.
Data correspond to usage on the plateform after 2015. The current usage metrics is available 48-96 hours after online publication and is updated daily on week days.
Initial download of the metrics may take a while.