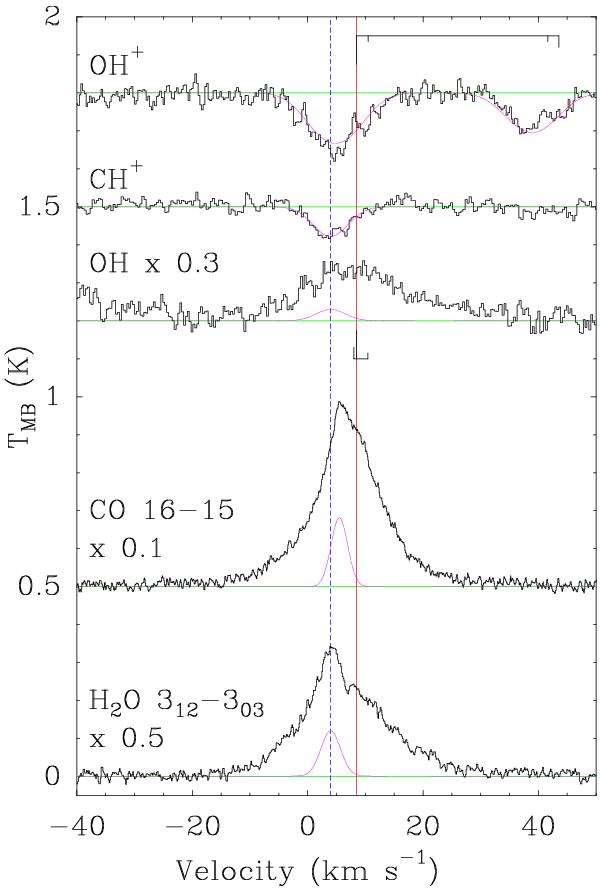
Fig. 3

Continuum-subtracted HIFI spectra of H2O, CO, OH, CH+, OH+ obtained towards the central position of Ser SMM1 (νsource = 8.5 km s-1). The red vertical line indicates νsource, while the blue dashed line shows the position of the offset component. The blended OH triplet is centred on the strongest hyperfine component as indicated by the three vertical black lines situated directly beneath the OH spectrum. The same is the case for the OH+ spectrum, with the location of the hyperfine components and their relative strengths indicated by the black lines above the spectrum. The spectra have been shifted vertically for clarity and in some cases scaled by a factor, indicated on the figure. CH+ and OH+ are fitted by a single Gaussian, OH by two, and CO and H2O by three; the offset components are shown in magenta.
Current usage metrics show cumulative count of Article Views (full-text article views including HTML views, PDF and ePub downloads, according to the available data) and Abstracts Views on Vision4Press platform.
Data correspond to usage on the plateform after 2015. The current usage metrics is available 48-96 hours after online publication and is updated daily on week days.
Initial download of the metrics may take a while.


