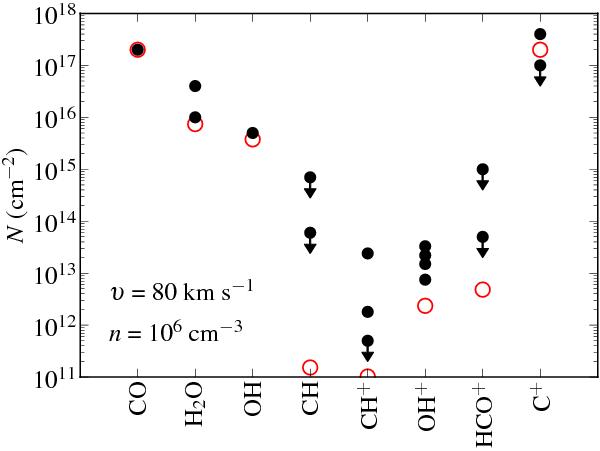
Fig. 10

Comparison of inferred column densities over the size of the emitting region and upper limits with shock model results from Neufeld & Dalgarno (1989) for a pre-shock density of 106 cm-3 and shock velocity of 80 km s-1. Observations are marked with black dots and arrows are for upper limits. For the cases where both a black dot and arrow are present (OH+ and C+) the dot marks the detection and the arrow the upper limit towards the other sources; when two arrows are present (CH and HCO+) they illustrate the range of upper limits. Model results are shown as red circles and are normalised to the inferred CO column density.
Current usage metrics show cumulative count of Article Views (full-text article views including HTML views, PDF and ePub downloads, according to the available data) and Abstracts Views on Vision4Press platform.
Data correspond to usage on the plateform after 2015. The current usage metrics is available 48-96 hours after online publication and is updated daily on week days.
Initial download of the metrics may take a while.


